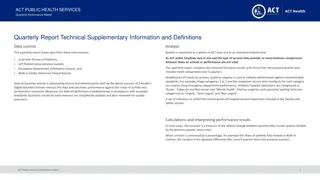
Quality Services Subcommittee Meeting October 2017 Performance Report
This report outlines the performance indicators for various regions in September 2017, including on-time performance, average hold times, calls on hold over 5 minutes, and preventable collisions per 100,000 miles. It also highlights key events such as staff attending the Emergency Management Summit.

Download Presentation

Please find below an Image/Link to download the presentation.
The content on the website is provided AS IS for your information and personal use only. It may not be sold, licensed, or shared on other websites without obtaining consent from the author.If you encounter any issues during the download, it is possible that the publisher has removed the file from their server.
You are allowed to download the files provided on this website for personal or commercial use, subject to the condition that they are used lawfully. All files are the property of their respective owners.
The content on the website is provided AS IS for your information and personal use only. It may not be sold, licensed, or shared on other websites without obtaining consent from the author.
E N D
Presentation Transcript
Operations Update Quality Services Subcommittee Meeting October ##, 2017
Performance Report Card Performance Indicator Standard Sep 2017 FY18 On Time Performance > 91% 89.3% 90.8% Late 4 < 0.10% 0.13% 0.09% Average Hold Time < 120 sec 76 80 Calls On Hold Over 5 Min < 5% 3.4% 4.2% *Preventable Collisions Per 100,000 Miles < 0.50 0.92 0.70 *Sep 2017 data is not final
Antelope Valley Region Performance Indicator Standard Sep 2017 FY18 On Time Performance > 91% 88.4% 89.5% Late 4 < 0.10% 0.06% 0.03% Average Hold Time < 120 sec 99 102 Calls On Hold Over 5 Min < 5% 3.2% 3.3%
Eastern Region Performance Indicator Standard Sep 2017 FY18 On Time Performance > 91% 89.5% 91.5% Late 4 < 0.10% 0.11% 0.10% Average Hold Time < 120 sec 65 66 Calls On Hold Over 5 Min < 5% 3.9% 4.8%
Northern Region Performance Indicator Standard Sep 2017 FY18 On Time Performance > 91% 91.2% 91.5% Late 4 < 0.10% 0.23% 0.12% Average Hold Time < 120 sec 85 92 Calls On Hold Over 5 Min < 5% 3.0% 3.9%
Santa Clarita Region Performance Indicator Standard Sep 2017 FY18 On Time Performance > 91% 95.8% 95.8% Late 4 < 0.10% 0.06% 0.04% Average Hold Time < 120 sec 47 49 Calls On Hold Over 5 Min < 5% 1.9% 2.1%
Southern Region Performance Indicator Standard Sep 2017 FY18 On Time Performance > 91% 88.8% 90.1% Late 4 < 0.10% 0.12% 0.09% Average Hold Time < 120 sec 84 91 Calls On Hold Over 5 Min < 5% 2.6% 3.7%
West Central Region Performance Indicator Standard Sep 2017 FY18 On Time Performance > 91% 89.1% 91.1% Late 4 < 0.10% 0.13% 0.08% Average Hold Time < 120 sec 67 65 Calls On Hold Over 5 Min < 5% 4.4% 4.9%
Highlights September highlights: > 3 staff attended the Southern California Advocacy Network s Emergency Management Summit > Safety Steering Committee focused on wheelchair securement > Cyber Security Workshop > Emergency Management training for staff > Southern Region Taxi Maintenance Audit
Highlights September highlights: > Presentation at the State Council on Developmental Disabilities, Los Angeles Office > Southern California Advocacy Network s Emergency Management Summit > Cyber Security Workshop > Emergency Management training > Southern Region Taxi Maintenance Audit > Safety Focus: Wheelchair Securement