Quantifying Benefits of TIM Strategies Project Overview
"This project aims to develop guidelines for analyzing and quantifying the impacts and economic benefits of Traffic Incident Management (TIM) strategies. The research includes tasks such as literature review, stakeholder case studies, applying evaluation methods, estimating capacity reductions, and validating metrics. The objective is to provide a comprehensive document for mid-level managers and analysts involved in TIM programs."
Download Presentation

Please find below an Image/Link to download the presentation.
The content on the website is provided AS IS for your information and personal use only. It may not be sold, licensed, or shared on other websites without obtaining consent from the author.If you encounter any issues during the download, it is possible that the publisher has removed the file from their server.
You are allowed to download the files provided on this website for personal or commercial use, subject to the condition that they are used lawfully. All files are the property of their respective owners.
The content on the website is provided AS IS for your information and personal use only. It may not be sold, licensed, or shared on other websites without obtaining consent from the author.
E N D
Presentation Transcript
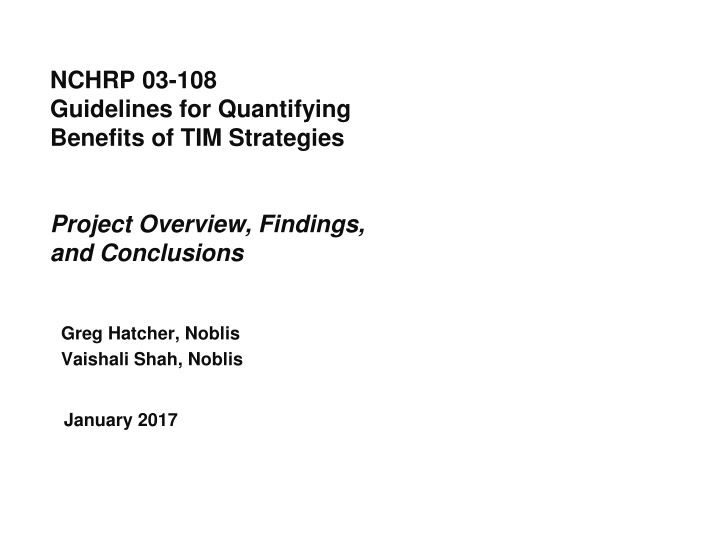
NCHRP 03-108 Guidelines for Quantifying Benefits of TIM Strategies Project Overview, Findings, and Conclusions Greg Hatcher, Noblis Vaishali Shah, Noblis January 2017
Agenda Project Background and Research Objectives Task 2: Literature Review, Stakeholder Case Studies, and Webinar Task 3: Apply and Test Selected TIM Evaluation Methods Task 4: Estimate Capacity Reductions for Different Incident Types Task 5: Guidelines Document Conclusions 2 2 NCHRP 03-108 Guidelines for Quantifying Benefits of TIM Strategies
Project Background & Research Objectives NCHRP 03-108 Guidelines for Quantifying Benefits of TIM Strategies 3
Project Background Traffic Incident Management (TIM) has received increased attention in recent years Increasing deployment and more resources allocated Benefits include road user and worker/responder safety, improved mobility and reliability, reduced emissions and fuel use TIM related analytical procedures (for estimation of impacts, benefit/cost of program/strategies, resource allocation, etc.) have made progress Many agencies have developed their own methods/tools. Federal Highway Administration (FHWA) has identified three incident specific performance measures for data collection and analysis, i.e., roadway clearance time, incident clearance time, and secondary incidents. However, there are inconsistencies in TIM-related estimation methods, and guidance is needed on what should be considered reasonable for accurate TIM program assessment and operations performance measurement under data rich and poor scenarios 4 4 NCHRP 03-108 Guidelines for Quantifying Benefits of TIM Strategies
Objectives of Research Develop a guidelines document for analyzing and quantifying Impacts of traffic incidents Economic benefits of TIM strategies Guide to include analysis methods addressing Varying TIM program maturity levels and data collection capabilities Capacity reduction estimate by roadway and incident factors Validation of commonly used and/or newly developed metrics Examples Guide audience is TIM program mid-level managers & analysts 5 5 NCHRP 03-108 Guidelines for Quantifying Benefits of TIM Strategies
Research Approach and Tasks 6 6 NCHRP 03-108 Guidelines for Quantifying Benefits of TIM Strategies
Research Methodology Search/Review Literature Stakeholder Input Apply and Test Methods Develop Guidance and Reports Benefits estimation frameworks Methods to calculate incident related capacity reductions Webinar Case studies NCHRP Panel Maryland (95/495) Dallas (North 75) Seattle (I-5) Virginia (495) Guidance Final report Implementation plan 7 7 NCHRP 03-108 Guidelines for Quantifying Benefits of TIM Strategies
Panel Input on Project Goals Panel Goals (from Kick-Off) Guidance Goals Present best practices in TIM quantification/monetization Establish comprehensive list of rules of thumb in TIM benefits Develop more solid methodology Develop consistent benefit-cost framework Provide means to justify and convince decision-makers the value of TIM Offer proper information to support effective investment decisions Engage first responders Focus on rural areas, corridors, and urban areas Quantification of benefits for data rich v. data poor Allocation of benefits across TIM strategies 8 8 NCHRP 03-108 Guidelines for Quantifying Benefits of TIM Strategies
Task 2 Findings Literature Review, Case Studies, and Webinar NCHRP 03-108 Guidelines for Quantifying Benefits of TIM Strategies 9
Literature Review & Evaluation Methods Outcomes from tactical TIM activities have been quantified but no attribution of benefit to strategic or support TIM activities Significant variation in the definition of the key terms of incident, and how other terms are defined, most notably secondary incident Captured local interpretations of performance measures Deep-dive analysis of 15 benefits estimation frameworks Proposed key methods to apply and compare Prepared Case Studies for four TIM Programs 10 10 NCHRP 03-108 Guidelines for Quantifying Benefits of TIM Strategies
Guidelines Needs & Uses Stakeholders Interest Stakeholders Quantify and Monetize TIM Outcomes to Justify funding within the Agency and State Legislatures Demonstrate value to Traveling Public Show the value of TIM across all members of the TIM community Proving that incentivized funding has significant public benefit Compare effectiveness against other ITS programs Guidelines Needs for Quantifying and Monetizing TIM Outcomes Expand benefits to fuel consumption and emissions monetization Defensible numbers navigating between the simple and the academic/complex methods for estimating TIM outcomes Consistency in defining secondary incidents outside the field Simple tool to assess the geographic coverage for safety service patrol 11 11 NCHRP 03-108 Guidelines for Quantifying Benefits of TIM Strategies
Selected Findings from the Webinar Programs may track performance measures but do not quantify or monetize TIM outcomes This is because they do not have adequate data, tools & methods, and staffing & funding to undertake this activity 12 12 NCHRP 03-108 Guidelines for Quantifying Benefits of TIM Strategies
Selected Findings from the Webinar 13 13 NCHRP 03-108 Guidelines for Quantifying Benefits of TIM Strategies
Task 3 Findings Apply and Test Selected TIM Evaluation Methods NCHRP 03-108 Guidelines for Quantifying Benefits of TIM Strategies 14
Task 3. Test TIM Outcome Estimation Methods The goals of this task are to test benefits estimation methods to: Examine how estimates of TIM outcomes vary across methods Examine effects from temporal and spatial aggregation on outcomes Identify strengths and shortcomings of selected TIM methods Document level of effort, challenges, and successes Select Methods to Apply & Evaluate Fuel Secondary Incidents Delay Emissions Consumption Select Data that Meet Method Needs Incident Data Demand Data Facility Data Clean and Merge Data Codify Segments Select Data Subset Fill Data Gaps Investigate Effect of Temporal & Spatial Aggregation on Benefits Apply Data & Document Range of Outcomes across Methods 15 15 NCHRP 03-108 Guidelines for Quantifying Benefits of TIM Strategies
Task 3. Methods Selected for Testing Simulation methods excluded given level of effort in calibrating models Empirical analysis not attempted given LOE in finding and processing before/after or with/without TIM Methods data needs to be met through available data, no new collection Methods based on previous empirical and simulation activities or expert judgement Emission and fuel use methods use vehicular delay avoidance as the key input or a multiplicative factor 3 Methods to Estimate Secondary Incident Avoidance 2 Methods to Estimate Emissions Reduction 3 Methods to Estimate Delay Reduction One Method to Estimate Fuel Savings 16 16 NCHRP 03-108 Guidelines for Quantifying Benefits of TIM Strategies
Estimating Traffic Delay Reduction Significant differences in delay estimation among methods While Chang uses empirical data on reducing duration of incidents from TIM, it employed simulation to estimate delay Conversely, Sun estimates of delay using ACR but assumes TIM performance Method Strengths Limitations Assumptions Excludes incidents with 3+ closed lanes response time with TIM 20 minutes, 35 minutes without Sun et al. incident duration not required Sensitive to urban v. rural, faciltiy lane count & lanes closed, and incident duration Directly computes delay savings, assumptions on non-TIM conditions are not needed Khattak and Rouphail Excludes incidents with 3+ closed lanes or duration > 60 minutes Non-TIM duration = 1.25 TIM duration for incidents CORSIM to estimate delay based on TIM and Non-TIM incident durations Chang and Igbinosun Does not analyze the impact of shoulder events Annualized Delay Reduction (Thousands of Vehicle Hours) N. Texas Seattle Maryland Dataset Sun Khattak Chang Sun Khattak Chang Sun Khattak Chang Full 399.1 94.9 3.3 3.3 2333.5 392.2 1312.0 640.6 11.2 10.8 15517.6 4084.1 1421.2 315.6 14.4 14.4 12461.9 1712.0 Equivalent 17 17 NCHRP 03-108 Guidelines for Quantifying Benefits of TIM Strategies
Volume Aggregation Input to Estimate Delay Demand prior to incident occurrence along with lane blockage is used to define the ACR for the facility Often levels of demand approximation will be made for a larger corridor versus a specific link or for average peak. Testing of different levels of aggregation suggest higher fidelity in temporal variation is more important than day of week or facility segmentation Incident Data Volume Data Hours of Delay Reduction - Seattle Segment - Level Estimate Corridor - Level Estimate Weekday & Weekday & Weekday & Weekday & 19.4 23.9 15.0 58.2 Matching Tool 15-minute 15-minute 15-minute 15-minute Weekend Weekend Weekend Weekend 1-hour 1-hour 1 hour 1 hour Daily Daily Daily Daily Month February June October Total 34.1 25.8 14.1 73.9 32.7 26.0 14.4 73.1 25.5 20.8 12.0 58.3 25.0 21.0 12.1 58.1 25.4 26.9 17.4 69.6 24.8 30.0 17.5 72.3 19.9 24.4 15.1 59.4 Joined Data 18 18 NCHRP 03-108 Guidelines for Quantifying Benefits of TIM Strategies
Task 3 Reduction in Secondary Crashes Identification of secondary crashes through temporal and spatial boundaries is an approximation of queued traffic from the incident Secondary crash avoidance is reverse engineered based on reduction in incident duration. This is not required in the Raub method. Sun et al. could only be applied to the MD dataset because it requires differentiation between a property damage and personal injury/fatality. Method Strength Limitation Ease of application, does not require "searching" for secondary incidents Does not consider unique time and space impacts of individual incidents Raub et al. (Findings) Hirunyanitiwattana and Mattingly Constant secondary crash "search" function Assumes impacts of incidents are identical Creates unique time and space "search" boundaries for each incident Cannot be applied to events with more than two lanes closed Chou "Search" boundaries defined by event characteristics Requires details on injury severity. Excludes incidents with 3+ closed lanes Sun et al. 19 19 NCHRP 03-108 Guidelines for Quantifying Benefits of TIM Strategies
Task 3 Reduction in Secondary Crashes Estimates are in the same range among methods from 2.7% to 7.3% compared to primary incidents No Method is highest or lowest among the three data sets Secondary Incident Reduction (Count) Based on Equivalent Dataset Seattle N. Texas Maryland Raub Mattingly Chou Raub Mattingly Chou Raub Mattingly Chou Sun Month February June October Total % Primary Incidents 4 6 6 1 2 3 6 2 3 6 8 5 6 16 20 18 54 13 23 19 55 9 22 22 24 69 15 13 35 15 8 28 17 5 27 17 15 41 16 11 7.3% 2.7% 5.0% 5.6% 4.5% 4.3% 5.5% 5.6% 4.1% 7.0% Annualized Reduction in Secondary Crashes Raub Mattingly Chou Sun 64 24 44 Washington 140 112 108 Texas 216 220 164 276 Maryland 20 20 NCHRP 03-108 Guidelines for Quantifying Benefits of TIM Strategies
Task 3 Emissions Reductions Emissions savings were calculated in two different ways as a function of delay and a function of the number of assists Chang and Igbinosun (2013) estimate emissions reduction based on locally calibrated emissions rates from the Maryland Department of Transportation and total delay Morris estimates reductions based on Safety Service Response Counts Chang Morris Pollutant Tons Emissions per hour of delay 25.676/106 338.69/106 36.064/106 Kg Emissions per Incident Response HC 3.51 CO 5.84 NOx 8.85 Annualized Emission Reduction based on Equivalent Datasets Chang Method Morris Method HC(Kg) CO(Kg) NO(Kg) HC(kg) CO(kg) NO(kg) Region Seattle N. Texas Maryland 10,072 104,864 43,956 132,844 1,383,228 579,844 14,144 147,288 61,744 4,620 10,304 15,864 47,164 105,228 161,996 11,648 25,984 40,004 21 21 NCHRP 03-108 Guidelines for Quantifying Benefits of TIM Strategies
Task 3. Conclusions Ground Truth is elusive, cannot determine accuracy of one versus another method When planning to quantify TIM outcomes, agencies should consider the following: Traffic demand and incident data sources, quality, availability Analysis period and corridor of interest Data/assumptions needed to address missing data and non-TIM performance Resources to customize/localize parameters TIM benefit estimation strategy strengths and limitations Capturing incident performance within and outside a TIM program s geographic and temporal footprint is critical to developing localized estimates of TIM s effectiveness in reducing incident duration An assumption of 25% reduction in the incident duration under non-TIM conditions is a generally acceptable practice and parallels the MD Chart experience Recognizing the limitations of each method used, the potential for hybrid delay estimation methods was explored 22 22 NCHRP 03-108 Guidelines for Quantifying Benefits of TIM Strategies
Task 4 Findings Estimate Capacity Reductions for Different Incident Types on Freeway Facilities NCHRP 03-108 Guidelines for Quantifying Benefits of TIM Strategies 23
Task 4. Methodology Review Volume, speed, occupancy up/down stream, incident start and end time, and lane closure type data collected Incident down selection includes: Within one mile of upstream or down stream detector No on/off ramp in the section Active bottlenecks present during incident A piecewise linear regression model of cumulative flow by time used to identify effective incident capacity Compare incident capacity against near peak to estimate capacity loss Application time consuming due to manual nature of processes 24 24 NCHRP 03-108 Guidelines for Quantifying Benefits of TIM Strategies
Task 4. Data Selection Data from 6 states considered but three eliminated because: Traffic volume and incident data could not be matched Detectors zeroed out volume data as errors during bottlenecks Absent lane closure type MD, VA, and TX had data types needed for analysis Manual review to confirm additional requirements of incident location relative to detectors Total of 109 incidents selected for analysis Incident Counts by Lanes Affected Three Lanes Two Lanes One Lane Shoulder Shoulder Accident Disabled Blocked Blocked Blocked Count State Lane Total MD VA TX Total MD VA TX Total MD VA TX Total MD VA TX Total 1 2 3 3 1 2 6 2 1 3 7 4 1 3 8 11 13 5 5 23 3 3 5 8 6 3 7 9 3 16 25 35 19 21 75 7 6 6 6 4 12 16 2 18 2 5 2 5 2 9 2 8 6 2 8 6 6 3 2 4 9 7 6 2 16 8 15 39 42 28 39 109 All 12 26 15 20 25 25 NCHRP 03-108 Guidelines for Quantifying Benefits of TIM Strategies
Description of the Incidents in Analysis 5 to 115 minute incident duration 0.06 to 0.99 ACR estimates Expected trends materialize ACR insensitive to duration More lanes blocked = lower ACR More lanes = higher ACR for a blockage level Incident types not well defined and overlap. One incident may have multiple codes. Incident Type Count 50 23 18 12 2 2 2 109 Collision Disabled Vehicle Incident Injuries Involved Vehicle on Fire Obstruction Emergency Roadwork Total 26 26 NCHRP 03-108 Guidelines for Quantifying Benefits of TIM Strategies
Task 4. State-Specific Findings For mainline blocking incidents on 3-lane facilities, the ACR is lower for TX than VA For 4-lane facilities, ACR is typically highest for MD and lowest in TX Available Capacity Ratio Estimates Three Lanes Blocked Lane Count Shoulder Disablement Shoulder Accident One Lane Blocked Two Lanes Blocked State MD VA TX 0.79 0.79 0.79 0.91 0.95 0.88 0.91 0.79 0.72 0.76 0.89 0.85 0.84 0.87 0.57 0.54 0.55 0.71 0.64 0.68 0.69 0.77 0.26 0.23 0.24 0.33 0.33 0.25 0.30 0.60 3 Combined MD VA TX Combined MD VA TX Combined 0.19 0.23 0.14 0.18 0.32 4 5 0.76 0.76 0.60 0.32 27 27 NCHRP 03-108 Guidelines for Quantifying Benefits of TIM Strategies
Task 4. Comparison to HCM ACR Specifications For shoulder disablements, current HCM ACR values are higher than estimates from this study. For one and two lane blocking incidents, current HCM ACR values are lower than estimates from this study Differences between HCM and this study are statistically significant at the 95% confidence interval for all italicized data. HCM and Estimated Available Capacity Ratio Values Shoulder Disablement Accident Number of Lanes by Direction Shoulder One Lane Blocked Two Lanes Blocked Three Lanes Blocked HCM 0.99 0.99 Study 0.79 0.91 HCM 0.83 0.85 Study 0.77 0.87 HCM 0.49 0.58 0.65 Study 0.55 0.69 0.76 HCM 0.17 0.25 0.40 Study 0.24 0.30 0.60 HCM Study 3 4 5 0.13 0.20 0.18 0.32 These findings suggest an underestimation of delays for shoulder disablements and an overestimation of delays for incidents where one or two lanes of traffic are blocked. 28 28 NCHRP 03-108 Guidelines for Quantifying Benefits of TIM Strategies
Task 4. Shoulder Disablement v. Accident HCM prescribes difference ACR values for shoulder disablements and accidents Analysis of the 24 shoulder incidents suggest that ACR is not statistically different between disablements and accidents For 3-lane facilities, ACR = 0.78 For 4-lane facilities, ACR = 0.88 HCM should consider a single ACR for shoulder incidents by number of lanes, not by type of incident 29 29 NCHRP 03-108 Guidelines for Quantifying Benefits of TIM Strategies
Task 4. Left v. Right Shoulder Incidents HCM prescribes no difference in ACR values for left versus right should incidents Data for shoulder incidents on 3- lane facilities is insufficient given only 1 event for the left shoulder Analysis of shoulder incidents on 4- lane facilities suggest that ACR is higher when the incident occurs on the right lane Right should blocked = 0.90 ACR Left shoulder blocked = 0.85 ACR HCM should consider a different ACR for left land and right lane shoulder incidents which varies by number of lanes in the facility 30 30 NCHRP 03-108 Guidelines for Quantifying Benefits of TIM Strategies
Task 4. Implications for HCM and Guidelines HCM estimates of available capacity ratio are a good starting point for use in estimating the delay associated with incidents HCM underestimates the impact of shoulder disablements, which occur more frequently than lane blocking incidents Shoulder disablement should be treated the same as shoulder accident when selecting an ACR Opportunities to broaden the analysis Automation in incident search process and in linking of incident and demand data Use of travel time data to help identify incidents and directly estimate delay ACR estimates are needed by lane blocked (left, center right), during poor visibility conditions, and for non-freeway facilities. 31 31 NCHRP 03-108 Guidelines for Quantifying Benefits of TIM Strategies
Task 5 Guidelines Document NCHRP 03-108 Guidelines for Quantifying Benefits of TIM Strategies 32
Snapshots of Guidelines TOC 33 33 NCHRP 03-108 Guidelines for Quantifying Benefits of TIM Strategies
Snapshot of Guidelines TOC 34 34 NCHRP 03-108 Guidelines for Quantifying Benefits of TIM Strategies
Benefits Analysis Process Comparison of Annualized Results from TIM-BC Tool with Various Methods Tested in Task 3 Delay Reductions (Thousands of Vehicle Hours) Fues Savings (Thousands of Gallons) Secondary Incident Reduction (count) Emissions Savings (Metric Ton) HC CO NO FHWA TIM-BC 1,126 FHWA TIM-BC 68 FHWA TIM-BC -0.76 -130.9 -0.4 FHWA TIM-BC -3.1 Chang 12,462 Mattingly 220 Chang 44.0 580.0 61.6 Chang 363.7 Sun 1,421 Sun 276 Morris 16.0 162.0 40.0 Khattak 14 Raub 216 Chou 164 35 35 NCHRP 03-108 Guidelines for Quantifying Benefits of TIM Strategies
Possible Questions to be Addressed by TIM Analysis What are the benefits of our TIM program? Do the benefits outweigh the costs? What is the overall value of our TIM program? What would be the impact of eliminating the TIM program? What would be the impact of reducing the number of hours that the service patrol operates? Does it make sense to expand the operating hours of the service patrol? Should we expand the service patrol to other network facilities in the region? Should we increase the network monitoring capabilities within the region? What would be the benefits of closer coordination with signals on the arterial street systems in an integrated corridor management framework? 36 36 NCHRP 03-108 Guidelines for Quantifying Benefits of TIM Strategies
HCM COMPARATIVES 37 37 NCHRP 03-108 Guidelines for Quantifying Benefits of TIM Strategies
Rules of Thumb Reviewed eight commonly referenced rules of thumb Identified strengths and limitations of each rule of thumb Offered caveats to use of rules of thumb More detailed fact sheets provided on four of these 38 38 NCHRP 03-108 Guidelines for Quantifying Benefits of TIM Strategies
Quick Sketch Method Near dataless method for quantifying delay savings from TIM Does not estimate safety benefits from TIM programs Methodology applied to two regions and compared against other methods to estimate delay, found within range 39 39 NCHRP 03-108 Guidelines for Quantifying Benefits of TIM Strategies
Summary and Conclusions Research Products/Contributions Guidelines for TIM practitioners Final report to document project Table of values to consider for updating HCM available capacity ratios Comparison of several different methods for estimating benefits of TIM strategies Fact sheets on TIM rules of thumb Quick sketch method developed for those without much data on incidents or traffic conditions Overall Findings and Implications of Research Many different TIM benefits estimation strategies are available Most suffer from a lack of high quality and accessible data Analyst must apply assumptions and rely on rules of thumb Data intensive methods did not necessarily outperform sketch methods One caveat: we did not test simulation models TIM-BC tool appears to be promising tool to support decision-making 40 40 NCHRP 03-108 Guidelines for Quantifying Benefits of TIM Strategies















![Project Initiation Document for [Insert.Project.name] [Insert.Project.number]](/thumb/226757/project-initiation-document-for-insert-project-name-insert-project-number.jpg)
