Quantifying Congestion in Australian Football
Australian football (AF) has seen changes in game speed and defensive styles, leading to increased player density around the ball. This study by Jeremy Alexander and team aims to quantify congestion in AF using player tracking technologies and machine learning algorithms. Two models are proposed to continuously measure player density and classify level of congestion during player disposals.
Download Presentation

Please find below an Image/Link to download the presentation.
The content on the website is provided AS IS for your information and personal use only. It may not be sold, licensed, or shared on other websites without obtaining consent from the author.If you encounter any issues during the download, it is possible that the publisher has removed the file from their server.
You are allowed to download the files provided on this website for personal or commercial use, subject to the condition that they are used lawfully. All files are the property of their respective owners.
The content on the website is provided AS IS for your information and personal use only. It may not be sold, licensed, or shared on other websites without obtaining consent from the author.
E N D
Presentation Transcript
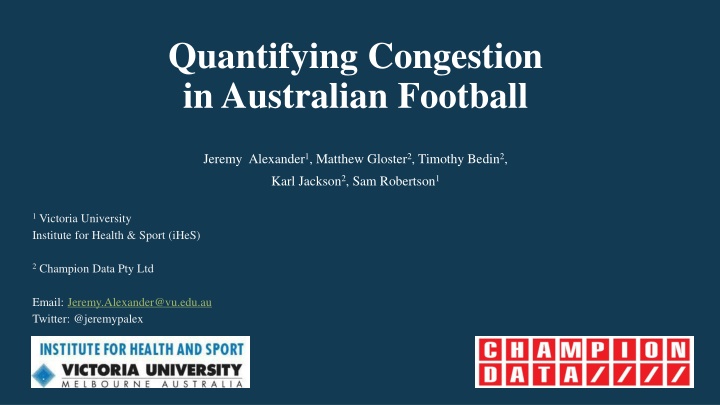
Quantifying Congestion in Australian Football Jeremy Alexander1, Matthew Gloster2, Timothy Bedin2, Karl Jackson2, Sam Robertson1 1 Victoria University Institute for Health & Sport (iHeS) 2 Champion Data Pty Ltd Email: Jeremy.Alexander@vu.edu.au Twitter: @jeremypalex
Background Australian football (AF) is a popular invasion sport played with two teams of 18 players Matches are divided into four quarters, each with 20 minutes of playing time Game-play has experienced a general trend of a faster game speed Angst that contemporary AF has suffered more defensive styles of play Key component is greater player density around the ball More contested match-play Limited time and space afforded to the playing with the ball, which may induce skill errors Stifles free-flowing ball movement
Background Impact on match-play is observed through: Increased count of possessions that are contested Increased tackle count Increased skill error count Decrease in overall effective passing (disposal) rates Associated link with a decline in scoring. Similar to World Cup football, rugby union and rugby league Negate the trend, major rule changes introduced by the AFL in recent years 1) Reduce player congestion and and elicit a more free-flowing game 2) Increase scoring by stimulating attacking styles of play
Background Studies have typically inferred congestion in AF via video analysis Human coder with raw counts of players within a five-metre radius of the ball at 15 sec intervals Unfeasible to scale this type of analysis Laborious Inefficient Prone to error Current method also precludes a continuous measure of congestion Difficult to determine the level of congestion a player experiences when disposing of the ball Advent of player tracking technologies provides a suitable data source to overcome these obstacles Location of teammates and opponents combined with machine learning algorithms to quantify congestion more effectively 1) Unsupervised: Clustering = Continuous congestion across each point in time 2) Supervised: Classification = Level of congestion during disposals
Aims Model 1 (unsupervised): Quantify congestion continuously at unique point in time during a match Determine the number of players situated higher player density vs lower player density Two output labels: Inside Outside Model 2 (supervised): Classify level of congestion a player experiences when disposing of the ball Representative understanding of how congestion may impact match-play Three output labels: High Nearby Low
Methods: Data Collection Data were collected from the 2019 and 2021 Australian Football League (AFL) regular seasons Matches (n = 56) were played at a single stadium Field dimensions are 159.5 m x 128.8 m (length x width) Matches were undertaken with four 20-min quarters 10 Hz local-positioning system (LPS) devices for all 44 participants Periods of play that lost the positioning of one or more players were omitted
Methods: Data Collection Match event data (kicks, marks, handballs) were recorded to the nearest tenth of a Field position of the ball was second separated into four zones by the two Disposals are the total number of kicks and handballs 50 m arcs and the centre of the ground Player tracking data were synchronised with match event data using the unix Defensive 50: D50 timestamps in both datasets Defensive Mid: DM Used to infer the location of the ball, which was specified to the nearest tenth of a Attacking mid: AM second Forward 50: F50
Model 1: Continuous Congestion Data Analysis Clustering techniques groups entities based on their similarity Typical approaches (k-means/GMM) are not suitable for the proposed aim Group points by the centroid Fixed number of clusters Density-based clustering techniques meet these requirements DBSCAN OPTICS Data points are assigned to a cluster by reachable distance
Model 1: Continuous Congestion Data Analysis Ordering Points To Identify the Clustering Structure (OPTICS) algorithm clusters players Players within congestion are identified as core points Minimum number of points within the neighbourhood of a specified radius Clusters of core points are randomly labelled 0-n Two parameters are used to assign points to a cluster: Players not assigned to a cluster (noise) are labelled as -1 Eps = minimum distance for a point to be considered within a cluster Eps = 7.5 m Convert labels to a practical output: Min points = minimum numbers of points required to be a cluster Min points = 4 players Highest count of players were re-labelled primary congestion Lesser player counts were re-assigned secondary congestion Players clustered as noise were considered outside congestion
Model 1: Continuous Congestion Data Analysis Pass model every unique time point in a match Mean standard deviation (95%) of proportion of players within each cluster Season (2019, 2021) Field position (D50, DM, AM, F50) Quarter (Q1, Q2, Q3, Q4)
Model 1: Continuous Congestion Results (Season) Proportion of players classified in each cluster Primary Secondary Outside Compared across 2019 and 2021 seasons Largely unchanged between seasons Small decrease in primary congestion Small increase in outside outside
Model 1: Continuous Congestion Results (Field Position) Proportion of players in each cluster across field position During 2019 and 2021 seasons Primary and secondary congestion were greater in the D50 and F50 when compared to DM and AM
Model 1: Continuous Congestion Results (Quarter) Proportion of players in each cluster compared across quarter During the 2019 and 2021 seasons Slight decrease in primary and secondary congestion as a match progresses
Model 1: Continuous Congestion Limitations Clustering only provide a label of inside or outside congestion Does not account for ball carrier when assessing degree of congestion Disposal would be classified as secondary congestion , which isn t practical A more representative measure would provide a categorised description
Model 2: Classify level of congestion during disposals Supervised approach where a model can be trained to classify the level of congestion To provide a training data, expert analysts from Champion Data manually labelled disposals 1943 disposals were labelled using the descriptions in table below Blind independent analysis was undertaken to ensure consistency with training dataset Label Description High Multiple players within 0-5 m of the ball Nearby Multiple players with 0-10m of the ball but player has space to make a decision Low There is one or fewer active players within 10m of the ball
Model 2: Classify level of congestion during disposals Classification model to predict the same labels of congestion (High, Nearby, Low) A range of spatiotemporal features were developed Player counts in designated regions surrounding ball-carrier Features Immediate Player Count (IPC) Total count of player within a 5 m radius Extended Player Count (EPC) Total count of player within a 10 m radius Immediate Defender Count (IDC) Total count of defenders within a 5 m radius Extended Defender Count (EDC) Total count of defenders within a 10 m radius Frontal Player Count (FC) Total count of players in front of ball-carrier Right Player Count (RC) Total count of players to the right of ball-carrier Left Player Count (LC) Total count of players to the left of ball-carrier Behind Player Count (BC) Total count of players behind the ball-carrier Available Space (AS) Area intersects between 10 m radius of player and the field of play
Model 2: Classify level of congestion during disposals Random Forest was selected due to base-model testing with lazypredict(python) Data split into training and testing (80:20) datasets Hyperparameters were optimised with GridSearchCV Removed Available Space feature as it didn t attribute to model Model performance was assessed based on standard metrics including precision, recall, and F1-Score Feature importance was displayed using SHAP values The confusion matrix and receiving operating characteristics (ROC) also examined model performance Features were used to classify every disposal from matches in 2019 and 2021 Mean standard deviation (95%) of breakdown of disposals within each category of congestion (High, Nearby, Low) Season (2019, 2021) Field position (D50, DM, AM, F50) Quarter (Q1, Q2, Q3, Q4)
Model 2: Level of congestion during disposals (Feature Importance) SHAP values display how the model is making decisions SHAP values display how the model is making decisions Global feature importance displays immediate and extended player counts when classifying the disposal label Local explanation summary exhibiting the direction of the relationship between feature and disposal label Reduced count in features to classify disposals in low congestion Greater count in features to classify disposals in high congestion The letters denote spatiotemporal features: IPC = Immediate Player Count; EPC = Extended Player Count; IDC = Immediate Defenders; EDC = Extended Defenders; BPC = Behind Player Count; RPC = Right Player Count; LPC = Left Player Count; FC = Frontal Player Count.
Model 2: Level of congestion during disposals (Fit/Accuracy) Disposals in high and low congestion we classified at a higher rate than disposal nearby congestion The ROC Curve computed similar results High: 0.89 precision and 0.86 recall High: 0.96 Nearby: 0.72 precision and 0.86 recall Nearby: 0.88 Low: 0.98 precision 0.88 recall Low: 0.96
Model 2: Level of congestion during disposals: Results (Season) Proportion of disposals within each level of congestion Compared across 2019 and 2021 seasons 3-4% decrease in disposals in high congestion Corresponding increase in disposals nearby/low congestion Nearly 60% of disposals are in high congestion or nearby congestion for both seasons
Model 2: Level of congestion during disposals: Results (Field Position) Similar patterns across both seasons Disposals in high congestion increased as a team transitioned towards their attacking end Similar trend for disposals nearby congestion Except for F50. Witnessed a decrease in nearby congestion and an increase in outside congestion Shots on goal from marks/free kicks
Model 2: Level of congestion during disposals: Results (Quarter) No discernable difference between seasons Steady decline in disposals within high congestion as a match progresses across each quarter Player fatigue, increased scoring margins where match outcome largely determined
Main Findings Model 1: Continuous congestion 25% of game time records players within some cluster of congestion (primary or secondary) Similar results reported in both 2019 and 2021 Model 2: Classify level of congestion during disposals Considerable decline in disposals within high congestion Players coalesce (throughout a match) in a similar manner, lesser extent around ball-carrier Rule changes may be having an impact on congestion Scoring stubbornly subdued Congestion, in and of itself, has a limited impact on scoring
Future Directions Measure differences between teams Variation within a season
Inform rule changes for AF Commission Practical Applications Compares similarities and differences in the game styles of teams Quantify game trends of match-play over time
