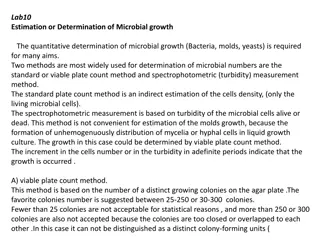
Quantitative Determination of Amylase Activity Experiment
Purpose of the experiment is to study the enzyme amylase, breaking down starch into maltose, using a standard curve to estimate maltose amounts. Includes construction of maltose std. curve, mix and incubation steps, and measuring absorbance at 520nm.

Download Presentation

Please find below an Image/Link to download the presentation.
The content on the website is provided AS IS for your information and personal use only. It may not be sold, licensed, or shared on other websites without obtaining consent from the author.If you encounter any issues during the download, it is possible that the publisher has removed the file from their server.
You are allowed to download the files provided on this website for personal or commercial use, subject to the condition that they are used lawfully. All files are the property of their respective owners.
The content on the website is provided AS IS for your information and personal use only. It may not be sold, licensed, or shared on other websites without obtaining consent from the author.
E N D
Presentation Transcript
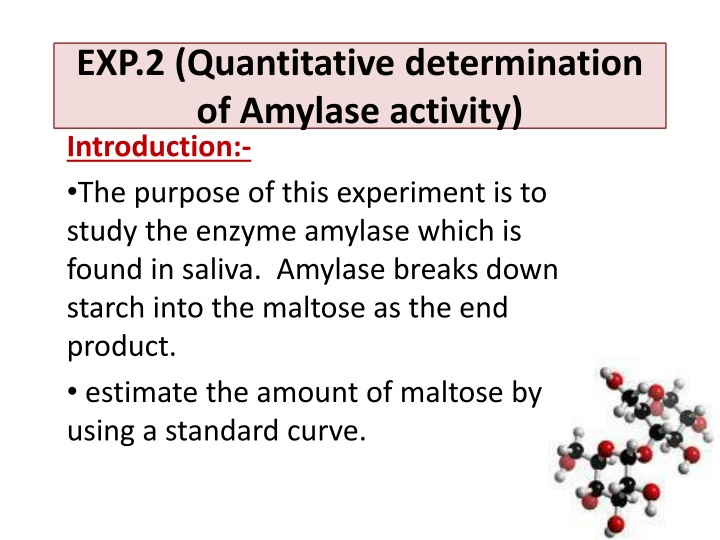
EXP.2 (Quantitative determination of Amylase activity) Introduction:- The purpose of this experiment is to study the enzyme amylase which is found in saliva. Amylase breaks down starch into the maltose as the end product. estimate the amount of maltose by using a standard curve. http://t3.gstatic.com/images?q=tbn:ANd9GcTMl7Ktp8MywQdSnkcDxZ15Z-csjhZrWzYQntPVF3v9zgxNQlMcpbOI8w
http://t0.gstatic.com/images?q=tbn:ANd9GcQXWj-KZCOdHi4kTKz7ujFdWQZjHEf3bCuZaR35TrTz5xwXH4FWic6YS8cjhttp://t0.gstatic.com/images?q=tbn:ANd9GcQXWj-KZCOdHi4kTKz7ujFdWQZjHEf3bCuZaR35TrTz5xwXH4FWic6YS8cj Beer's law states that the absorbance is directly proportional to the concentration of a solution. If you plot absorbance versus concentration, the resulting graph yields a straight line. C1 V1 = C2 V2 http://t3.gstatic.com/images?q=tbn:ANd9GcTtzSSqzrnM2GO3tIaQih6kR3kp6mDXOrF7pJLcitwjOiihn0TpTCMR8Q
Principle Maltose + alkaline dinitrosalicylic acid http://t1.gstatic.com/images?q=tbn:ANd9GcTlgWL_hBHeaLU2rCVxhyI_vvvkUav_ZWJoMIGfjfWz5QdloBE0Wtmb-xgq Orange-red colour
Procedure Part (1): construction of maltose std. Curve: Std.1 0.1 Std.2 0.5 Std.3 1.5 Std.4 2 Maltose( 1mg/ml) H2O Reagent( ml) 10 mins., boiling water bath. And cool, H2O (ml) 6 1.9 2 1.5 2 0.5 2 --- 2 6 6 6 Read the Abs at 520 nm.
Part (2): tube1 tube2 tube3 Phosphate buffer 2.5 ml 2.5 ml 2.5 ml Starch solution 2.5 ml 2.5 ml 2.5 ml NaCl (1%) 1 1 1 Mix, incubate 10 mins at 37 c H2O 1 0.5 0.5 Diluted saliva --- 0.5 0.5 NaOH ---- ---- 0.5 1&2 incubation15 mins, 37 c NaOH 0.5 0.5 ---- Reagent 0.5 0.5 0.5
Mix, heat in boiling water for 5 mins. cool it at R.T add 2 ml H2O Read Abs at 520nm.


:")