Quarterly Evaluation Updates for Supported Families and Stronger Community
This quarterly evaluation report provides detailed insights on the referral tracking, protective factors survey results, navigation team case management, and overall progress of the Supported Families, Stronger Community program. It includes information on the number of referrals, referral alignment with protective factors, and tracking forms submitted since the launch and throughout the fiscal year, offering a comprehensive overview of the program's impact.

Download Presentation

Please find below an Image/Link to download the presentation.
The content on the website is provided AS IS for your information and personal use only. It may not be sold, licensed, or shared on other websites without obtaining consent from the author. If you encounter any issues during the download, it is possible that the publisher has removed the file from their server.
You are allowed to download the files provided on this website for personal or commercial use, subject to the condition that they are used lawfully. All files are the property of their respective owners.
The content on the website is provided AS IS for your information and personal use only. It may not be sold, licensed, or shared on other websites without obtaining consent from the author.
E N D
Presentation Transcript
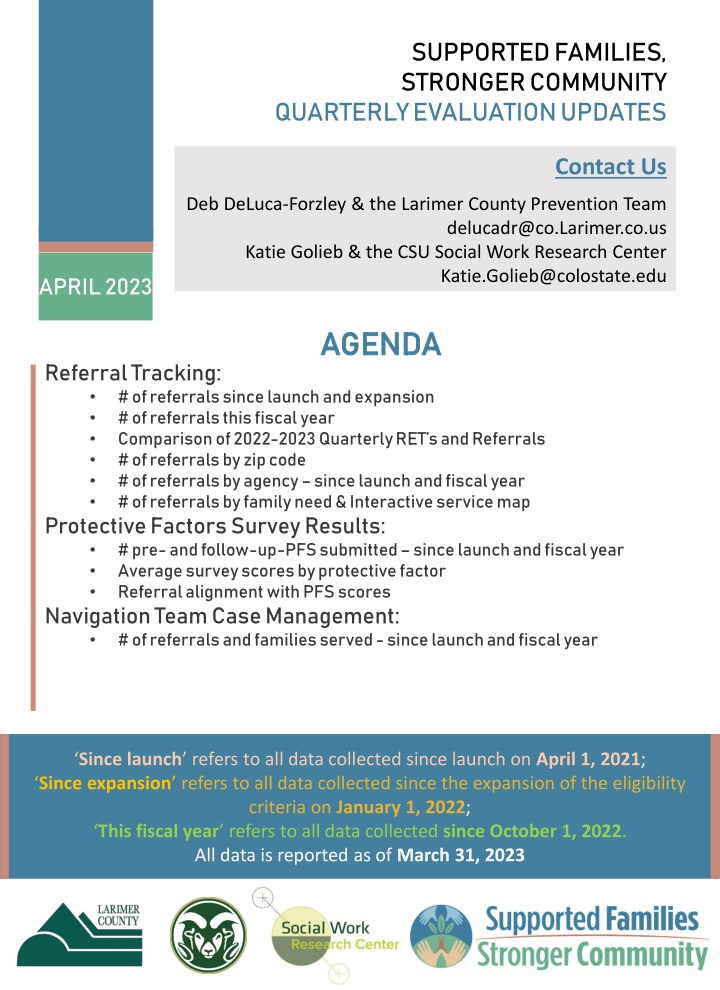
SUPPORTED FAMILIES, STRONGER COMMUNITY QUARTERLY EVALUATION UPDATES Contact Us Deb DeLuca-Forzley & the Larimer County Prevention Team delucadr@co.Larimer.co.us Katie Golieb & the CSU Social Work Research Center Katie.Golieb@colostate.edu APRIL 2023 AGENDA AGENDA Referral Tracking: # of referrals since launch and expansion # of referrals this fiscal year Comparison of 2022-2023 Quarterly RET s and Referrals # of referrals by zip code # of referrals by agency since launch and fiscal year # of referrals by family need & Interactive service map Protective Factors Survey Results: # pre- and follow-up-PFS submitted since launch and fiscal year Average survey scores by protective factor Referral alignment with PFS scores Navigation Team Case Management: # of referrals and families served - since launch and fiscal year Since launch refers to all data collected since launch on April 1, 2021; Since expansion refers to all data collected since the expansion of the eligibility criteria on January 1, 2022; This fiscal year refers to all data collected since October 1, 2022. All data is reported as of March 31, 2023
Forms and Tracking of Referral Episodes and Protective Factors Survey Collects total number of organizations/agencies that a family member is referred to Captures referral information where the referral came from, where it s going to Captures how each referral episode aligns with the Protective Factors (e.g. Please select which protective factor(s) you made this referral for ) Referral Episode Tracking (RET) PFS and RET Web-based Qualtrics forms go directly to CSU The five protective factors in the PFS assesses family protective factors Completed with family at baseline (e.g., initial referral) and every 3 months thereafter with those continuing to receive case management A mean (average) is calculated for each of the five protective factors which can range from 1-4 (4 indicating a strong presence of that protective factor) The PFS provides agencies with a snapshot of the families they serve and measures change over time Reminder: The Referral Episode Tracking form is a tracking mechanism that is distinct from referrals to the SFSC navigation team and from an actual referral to another agency PAGE 2 SUPPORTED FAMILIES, STRONGER COMMUNITY APRIL 2023 CCT UPDATES
How many referrals have been submitted since launch? Referral Episode Tracking Forms (RET) 2,147 Referral episodes across all forms 1,200 Referral Episode Tracking Forms submitted since launch An average of 1.79 referrals are submitted per form Referrals by Month Since Launch 135 MAR 79 136 FEB 71 2023 156 JAN 85 137 DEC 66 116 NOV 70 92 OCT 52 79 SEPT 46 119 AUG 65 140 JULY 72 162 JUNE 78 133 MAY 76 146 APR 69 2022 163 MAR 90 91 (Project Expansion) FEB 53 71 JAN 45 47 DEC 35 33 NOV 25 13 OCT 9 23 SEPT 14 26 AUG 2021 13 23 JULY 14 17 JUNE 13 57 MAY 39 15 APR 14 0 20 40 60 80 100 120 140 160 Referral Episodes Referral Episode Tracking Forms PAGE 3 SUPPORTED FAMILIES, STRONGER COMMUNITY APRIL 2023 CCT UPDATES
How many referrals have been submitted this fiscal year fiscal year? Referral Episode Tracking Forms (RET) 425 Referral Episode Tracking (RET) Forms submitted this fiscal year fiscal year (FY) 778 Referral episodes submitted across all forms 560 Referrals Progress to Goal 76% An average of 1.84 referrals are submitted per form Referrals by Month this Fiscal Year 92 October 2022 52 116 November 2022 70 137 December 2022 66 156 January 2023 85 136 February 2023 71 135 March 2023 79 0 50 100 150 Referral Episodes Referral Episode Tracking Forms PAGE 4 SUPPORTED FAMILIES, STRONGER COMMUNITY APRIL 2023 CCT UPDATES
Comparison of 2022-2023 Monthly RET s and Referrals From 2021 to 2022, the numbers of submitted tracking forms and referral episodes doubled in monthly comparisons. Looking at the first quarter s comparison between 2022 to 2023, we observe continued increases in submitted RET forms in January and February, and a slight decrease in the number of forms submitted in March 2023 compared to March 2022. 2022-2023 Monthly Comparison (1st Quarter) 163 156 160 136 135 140 120 100 91 90 85 79 80 71 71 60 53 45 40 20 0 JAN 2022 JAN 2023 FEB 2022 FEB 2023 MARCH 2022 MARCH 2023 In each grouping the darker color represents number of Referral Episode Tracking (RET) forms submitted and lighter color represents number of Referrals captured in the forms PAGE 5 SUPPORTED FAMILIES, STRONGER COMMUNITY APRIL 2023 CCT UPDATES
How many referral episode tracking forms (RETs) have been submitted based on family members zip code? Number of RETs by Zip Code Since Expansion 80553 (FC) 1 80549 (Wellington) 8 14 80547 (Timnath) 4 5 80538 (LV) 183 212 80537 (LV) 115 127 80536 (Livermore) 5 80535 (Laporte) 11 9 80534 (Berthoud) 6 7 80528 (LV/FC) 28 32 80527 (FC) 6 80526 (FC) 133 160 80525 (FC) 142 180 80524 (FC) 97 144 80521 (FC) 67 102 80517 (Estes Park) 20 80513 (Berthoud) 141 175 80512 (Bellvue) 1 0 100 200 300 400 500 Legend As of Jan 2023 As of March 2023 Original Zip Code Reminder: All families that reside in any zip code that intersects with Larimer County are now eligible to participate in this Initiative PAGE 6 SUPPORTED FAMILIES, STRONGER COMMUNITY APRIL 2023 CCT UPDATES
How many RETs have been submitted by each agency type since launch and this fiscal year? Since Launch of Onboarded Agencies Have Submitted at least one Referral Episode Tracking (RET) Form since launch 83% Goal: >70% of agencies submit >1 RET annually This Fiscal Year of Agencies Have Submitted at least one Referral Episode Tracking Form (RET) this fiscal year 71% 71% of agencies Progress to Goal 17 7 PAGE 7 SUPPORTED FAMILIES, STRONGER COMMUNITY APRIL 2023 CCT UPDATES
Which needs have staff been addressing when making referrals since launch? 1,635 Protective Factor(s) Selected by Agency Staff for Each Referral Episode Families perception of formal services and supports available for basic needs (i.e., financial and housing support, food stamps) Concrete Supports 944 Family Families perception of adaptive skills and strategies to navigate times of crisis Functioning & Resilience 422 Families perception of informal support systems (i.e., friends, family and community members) Social Supports 274 Interactive Service Mapping Platform Perceived strength of emotional connection between parent or caregiver and child(ren) Nurturing & Attachment http://rebrand.ly/sfscmap This map is updated monthly by the SWRC team with the most recent referral data. All data since launch is included in this map., We recommend bookmarking the link so that you can check back for updates! 193 Caregiver & Practitioner Relationship Knowledge of effective child management techniques 76 Unsure Legend Number of times that protective factor was selected across all referral episodes Protective factor selected PAGE 8 SUPPORTED FAMILIES, STRONGER COMMUNITY APRIL 2023 CCT UPDATES
How many PFS have been submitted since launch and what do the scores show? 204 53 Initial PFS have been submitted Follow-up PFS have been submitted 54% Of agencies have submitted >1 PFS 37 # of 3-Month PFS submitted since launch 12 # of 6-Month PFS submitted since launch 4 # of 9-Month PFS submitted since launch 13 11 agencies agencies Submitted at least 1 PFS Have not submitted any PFS Goal: >70% of agencies submit >1 PFS annually Average PFS Scores at Baseline and at Post 4.0 Average Pre Score 3.5 3.3 3.0 Average Post Score 3.0 3.0 2.8 2.7 2.5 2.4 2.4 2.4 2.5 2.2 2.0 1.5 1.0 Family Nurturing and Attachment Social Supports Caregiver and Practitioner Relationship Concrete Supports Functioning and Resilience PAGE 9 SUPPORTED FAMILIES, STRONGER COMMUNITY APRIL 2023 CCT UPDATES
How many PFS have been submitted this fiscal year? 41 33 Initial PFS have been submitted in FY2022 Follow-up PFS have been submitted in FY2022 17 17% Of agencies have submitted >1 PFS # of 3-Month PFS submitted this fiscal year 14 # of 6-Month PFS submitted this fiscal year 2 # of 9-Month PFS submitted this fiscal year 4 20 agencies agencies Submitted at least 1 PFS Have not submitted any PFS Goal: >70% of agencies submit >1 PFS annually Trends in PFS Submissions Since Expansion 204 200 150 130 113 98 100 69 53 45 38 50 24 15 11 11 0 January 2022 April 2022 July 2022 October 2022 January 2023 April 2023 Initial PFS Post-PFS PAGE 9 SUPPORTED FAMILIES, STRONGER COMMUNITY APRIL 2023 CCT UPDATES
How do families needs and referrals made by agency staff align? Average Initial PFS Scores (n=204) and # of Referrals Targeting Each Protective Factor since launch 4 1700 1635 1600 1500 1400 1300 3.1 1200 3 1100 2.7 1000 2.5 944 900 2.4 800 700 2.1 600 2 500 422 400 300 274 193 200 100 1 0 Family Nurturing and Attachment Social Supports Caregiver and Practitioner Relationship Concrete Supports Functioning and Resilience Average PFS score # referrals made for that protective factor Legend Data Interpretation Note: The lower the average score for the protective factor, the greater number of referrals we expect to see, which is what we are finding. In other words, the data show that Larimer County families have the greatest need for concrete supports, which is the protective factor receiving the most referrals. PAGE 10 SUPPORTED FAMILIES, STRONGER COMMUNITY APRIL 2023 CCT UPDATES
Who are the SFSC Community Navigators and what is their role in this Initiative? The four SFSC Community Navigators Rod, Tomas, Mary, and Elise have a range of backgrounds and experiences and were hired as part of the grant to support families across Larimer County SFSC Navigation Team Referrals to the SFSC Navigators are made by emailing Deb or the navigators directly with a completed referral form. These referrals are also entered into the Referral Episode Tracking form in Qualtrics for tracking purposes Referrals to Navigators The navigators may work with families in various ways: service connections and referrals for less than 30 days ( community connections ), or opening a light or high intensity case, meaning working with the family for a period greater than 30 days Service Navigation & Case Management PAGE 11 SUPPORTED FAMILIES, STRONGER COMMUNITY APRIL 2023 CCT UPDATES
How many referrals have been submitted to the navigators since launch and what happens after a referral? Flow of families after being referred to SFSC navigators 377 Referred to SFSC Community Navigation Team 338 Screened in 305 Successfully Contacted 68 71 108 68 Community connections High intensity SN/CM Light Intensity SN/CM No referrals Data Interpretation Note: The numbers of the bottom 4 funnels (high intensity, light intensity, communication connections, and no referrals) do not add up to the number of families successfully contacted, as at any point in time there are families who are in the early stages of support and have not yet been assigned a service tier. Goal: Each year, 100 families receive community connections, 100 receive light intensity case management and 75 receive high intensity case management. PAGE 12 SUPPORTED FAMILIES, STRONGER COMMUNITY APRIL 2023 CCT UPDATES
How many referrals have been submitted to the navigators this fiscal year and what happens after a referral? Flow of families after being referred to SFSC navigators 147 Referred to SFSC Community Navigation Team 128 Screened in 117 Successfully Contacted 47 17 49 16 Community connections High intensity SN/CM Light intensity SN/CM No referrals Progress to Goal High intensity 1% 75 families 63% Light intensity 11% 100 families 17% Community Connections 14% 100 families 49% PAGE 13 SUPPORTED FAMILIES, STRONGER COMMUNITY APRIL 2023 CCT UPDATES
Thank you for everything that you do to support this Initiative and families across Colorado! For more resources and information about the SFSC Initiative and evaluation, please e-mail Katie or Deb at anytime, and remember to check out our new website! https://www.larimer.gov/humanservices/cyf/supported- families-stronger-community