Radiology Applications in SPSS: A Comprehensive Guide
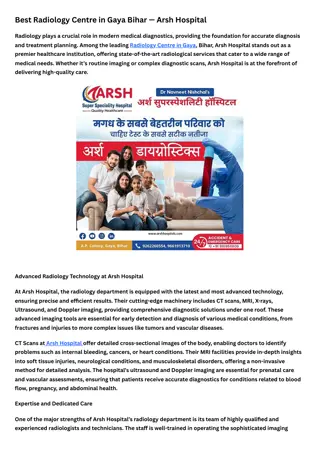
Radiology, a vital medical discipline, utilizes imaging techniques like X-ray, MRI, CT scans, and ultrasound for diagnosing and treating diseases. Patient data and research play a crucial role in radiology. Explore the significance of data and the introduction to SPSS software for statistical analysis. Learn why SPSS is essential in radiology for analyzing patient outcomes, comparing imaging techniques, and supporting evidence-based practice. Discover how to collect and enter data in SPSS, perform descriptive statistics, and compare imaging techniques. Dive into examples to better understand the practical applications of SPSS in radiology.

Download Presentation

Please find below an Image/Link to download the presentation.
The content on the website is provided AS IS for your information and personal use only. It may not be sold, licensed, or shared on other websites without obtaining consent from the author. If you encounter any issues during the download, it is possible that the publisher has removed the file from their server.
You are allowed to download the files provided on this website for personal or commercial use, subject to the condition that they are used lawfully. All files are the property of their respective owners.
The content on the website is provided AS IS for your information and personal use only. It may not be sold, licensed, or shared on other websites without obtaining consent from the author.
E N D
Presentation Transcript
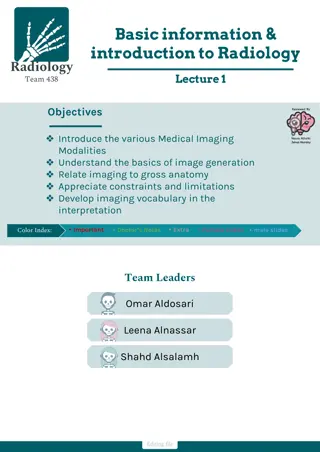
Overview of Radiology Radiology is a medical discipline that uses imaging to diagnose and treat diseases. Common imaging techniques: - X-ray - MRI - CT scan - Ultrasound
Importance of Data in Radiology Patient data: Demographics, medical history, imaging results. Research: Clinical trials, studies on imaging efficacy.
Introduction to SPSS SPSS (Statistical Package for the Social Sciences) is a software used for statistical analysis. Key features: - Data entry - Analysis - Visualization
Why Use SPSS in Radiology? Analyze patient outcomes. Compare imaging techniques. Support evidence-based practice.
Collecting Data for SPSS Example: Patient imaging data (e.g., age, diagnosis, imaging modality). File formats: Excel, CSV.
Data Entry in SPSS Steps: 1. Open SPSS 2. Import dataset 3. Define variables (e.g., Name, Type, Label)
Example 1: Descriptive Statistics Scenario: Analyze the average age of patients undergoing MRI. Steps: 1. Select 'Analyze' 2. Choose 'Descriptive Statistics' 3. Click 'Frequencies' or 'Descriptives' and select the 'Age' variable 4. Generate results Example Data: - Ages: 25, 30, 35, 40, 45 Calculation: - Mean = (25 + 30 + 35 + 40 + 45) / 5 = 35
Example 2: Comparing Imaging Techniques Scenario: Compare the accuracy of MRI and CT scan for diagnosing a condition. Steps: 1. Enter data for MRI and CT in separate columns 2. Select 'Analyze' 3. Choose 'Compare Means' > 'Independent-Samples T-Test' 4. Define grouping variable and test variable 5. Click 'OK' to view results Example Data: - MRI: 90%, 85%, 88%, 92%, 87% - CT: 80%, 82%, 78%, 85%, 83% Interpretation: - Significant difference (p < 0.05)
Comparing the accuracy of MRI vs. CT in diagnosing a specific condition. Steps: 1. Data Entry: - Enter MRI and CT data in separate columns. - Example Data: - MRI: 90%, 85%, 88%, 92%, 87% - CT: 80%, 82%, 78%, 85%, 83% 2. SPSS Procedures: - Go to Analyze > Compare Means > Independent-Samples T-Test. - Define: - Grouping Variable: Set groups (e.g., MRI and CT). - Test Variable: Define the variable to test (e.g., diagnostic accuracy). - Click OK. 3. Results and Interpretation: - Results will display in a table. - If p-value < 0.05, there is a statistically significant difference between MRI and CT accuracy
Example 3: Correlation Analysis Scenario: Correlate patient age with imaging outcomes. Steps: 1. Enter 'Age' and 'Outcome' data in two columns 2. Select 'Analyze' 3. Choose 'Correlate' > 'Bivariate' 4. Select variables and click 'OK' 5. Interpret correlation coefficient Example Data: - Ages: 20, 30, 40, 50 - Outcomes: 80, 85, 90, 95 Interpretation: - Correlation coefficient (r) = 0.98 (strong positive correlation)
Types of Visualizations: - Bar Charts - Pie Charts - Line Graphs Example: Distribution of Imaging Techniques - X-ray: 40% - MRI: 30% - CT: 20% - Ultrasound: 10% Steps in SPSS: 1. Go to Graphs and select the appropriate chart type. 2. Input data for each imaging technique. 3. Click OK to generate the chart. Purpose: - Simplify data understanding. - Provide accurate visual representation.
Visualizing Data in SPSS Types of visualizations: - Bar charts - Pie charts - Line graphs Example: Imaging modality distribution in a dataset: - X-ray: 40% - MRI: 30% - CT: 20% - Ultrasound: 10%
Conclusion and Q&A Recap: Importance of radiology data, SPSS applications. Encourage practice with real-world datasets.