Radiometry Updates and Testing Experiments for Ocean Sensors
Explore the latest radiometry updates and testing experiments conducted on ocean sensors, covering topics such as dock tests, water splash tests, WISP tests, sensor variations, and sensor positioning impact.

Download Presentation

Please find below an Image/Link to download the presentation.
The content on the website is provided AS IS for your information and personal use only. It may not be sold, licensed, or shared on other websites without obtaining consent from the author. If you encounter any issues during the download, it is possible that the publisher has removed the file from their server.
You are allowed to download the files provided on this website for personal or commercial use, subject to the condition that they are used lawfully. All files are the property of their respective owners.
The content on the website is provided AS IS for your information and personal use only. It may not be sold, licensed, or shared on other websites without obtaining consent from the author.
E N D
Presentation Transcript
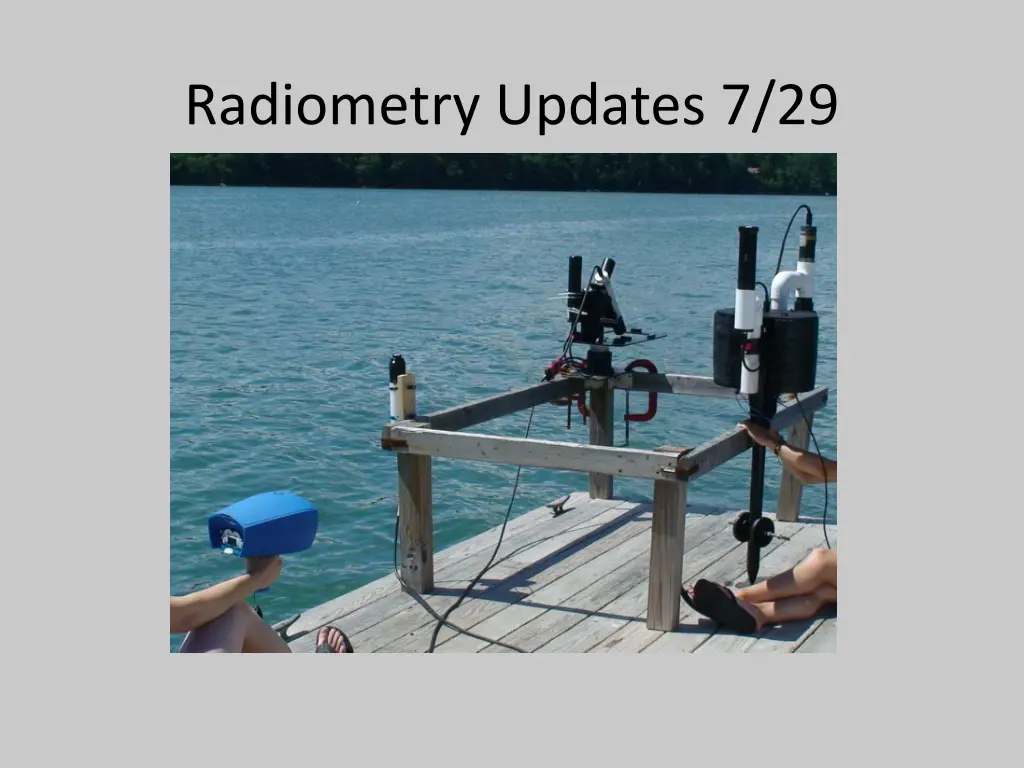
Dock Test 7/27 Test 1: All Sensor Test Same dock location for WISP, SAS base, and buoyed HyperPro SAS Ed sensor located on upper dock Test 2: Ed Sensor Test Same dock location for all sensors Test 3: Water Splash Test on HyperPro Ran HyperPro for 1-2 minutes normal Ran HyperPro for 1-2 minutes after splashing water on the upwelling radiance sensor
WISP Test 1: Every 30 seconds for 5-6 minutes All Sensors Test 1, Wavelength v. Rrs 0.01 0.009 Good Agreement with Time (Some boat wakes and waves) 0.008 0.007 0.006 Rrs (1/sr) 0.005 0.004 0.003 0.002 Kick in 750- 800 Smaller 0.001 0 400 450 500 550 600 650 700 750 800 Wavelength
Test 2: Ed Test 1: All Sensors Ed Test All Test 2 2 1.8 1.8 1.6 1.6 1.4 1.4 Ed (Watts/sqm nm) Ed (Watts/sqm nm) 1.2 1.2 1 1 0.8 0.8 0.6 0.6 0.4 0.4 0.2 0.2 0 0 400 500 600 700 800 400 500 600 700 800 Wavelength Wavelength Used Median Values To Compare with SAS/Pro Good Agreement of Ed values with Time
Test 1: SAS Ed Sensor On Upper Dock Difference Can Be +10%
Test 2: SAS Ed Sensor On Lower Dock Difference As Big
Test 3: Variability in Lw and Rrs Slightly Better with Ed Sensor Closer
Recommendations? Keeping in mind that the SAS and/or Pro may have calibration issues, using WISP in open water doesn t look promising as is * Gimbal the WISP Put a level bubble on the under side of the WISP Add automatic sampler feature (every x seconds)
EXTRA FIGURES:WISP All Sensors Test 1, Wavelength v. Lu 0.015 0.01 Lu (Watts/sqm nm sr) All Sensors Test 1, Wavelength v. Ld 0.06 0.005 0.05 0.04 Ld (Watts/sqm nm sr) 0 400 450 500 550 600 650 700 750 800 Wavelength 0.03 0.02 0.01 0 400 450 500 550 600 650 700 750 800 Wavelength


")


