Rail Energy Transportation Update - Impact of COVID-19 on Freight Cars
Industry order activity and railcar deliveries were significantly affected by COVID-19 and energy market collapse. The outlook for railcar deliveries is expected to contract due to economic downturn and oversupply of certain fleets. Coal demand continues to decline, leading to the scrapping of older cars and storage of a significant percentage of coal cars.
Download Presentation

Please find below an Image/Link to download the presentation.
The content on the website is provided AS IS for your information and personal use only. It may not be sold, licensed, or shared on other websites without obtaining consent from the author. If you encounter any issues during the download, it is possible that the publisher has removed the file from their server.
You are allowed to download the files provided on this website for personal or commercial use, subject to the condition that they are used lawfully. All files are the property of their respective owners.
The content on the website is provided AS IS for your information and personal use only. It may not be sold, licensed, or shared on other websites without obtaining consent from the author.
E N D
Presentation Transcript
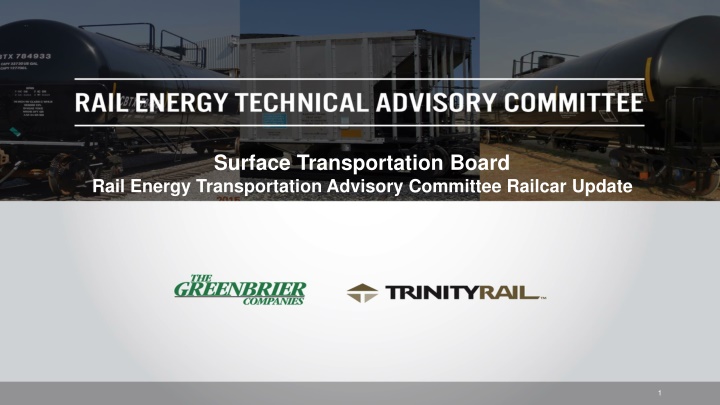
Surface Transportation Board Rail Energy Transportation Advisory Committee Railcar Update 1
Industry Order Activity was Severely Hampered by COVID-19 and Energy Market Collapse Freight Car Activity 20,000 100,000 Orders/Deliveries 80,000 15,000 Backlog 60,000 10,000 40,000 5,000 20,000 0 0 Q1 2015 Q2 2015 Q3 2015 Q4 2015 Q1 2016 Q2 2016 Q3 2016 Q4 2016 Q1 2017 Q2 2017 Q3 2017 Q4 2017 Q1 2018 Q2 2018 Q3 2018 Q4 2018 Q1 2019 Q2 2019 Q3 2019 Q4 2019 Q1 2020 Q2 2020 Orders Deliveries Backlog Tank Car Activity 12,000 60,000 Orders/Deliveries 9,000 45,000 Backlog 6,000 30,000 3,000 15,000 0 0 Q1 2015 Q2 2015 Q3 2015 Q4 2015 Q1 2016 Q2 2016 Q3 2016 Q4 2016 Q1 2017 Q2 2017 Q3 2017 Q4 2017 Q1 2018 Q2 2018 Q3 2018 Q4 2018 Q1 2019 Q2 2019 Q3 2019 Q4 2019 Q1 2020 Q2 2020 Orders Deliveries Backlog 2
Railcar Delivery Outlook Expected To Contract Railcar Delivery Forecast Source: ARCI; FTR Forecasted delivery reduction due to economic downturn and uncertainty caused by COVID-19 and oversupply of certain fleets Tank cars, 3,500-5,500 cf, covered hoppers for grain, >5,500cf covered hoppers for plastics, and intermodal flat cars are expected to support future deliveries Non-energy tank cars will drive new tank car demand 70,000 Actual Forecast 60,000 50,000 40,000 Railcars 30,000 20,000 10,000 0 2017 2018 2019 2020 2021 2022 Freight Tank 3
Coal demand continues to decline, leading to older cars being scrapped Estimated Coal Car Age Distribution Source: UMLER Analysis Coal carloads are down 27.2% year- to-date in 2020 70,000 30% of gondolas and 34% of open hoppers in the North American fleet are in storage as of September 2020 60,000 50,000 40,000 The railcar fleet servicing coal will see continued attrition in the coming years 30,000 20,000 ~35,000 coal railcars are over 35 years old 10,000 0 0 - 5 6-10 11-15 16 - 20 21 - 25 26 - 30 31 - 35 36 - 40 41 - 45 46 - 50 Age 51 + 4 Source: AAR Weekly Carload Traffic September 12, 2020.
Percent of coal cars in storage rose sharply starting in late 2019 before recent reductions in idle rates Open Hopper and Gondola Idle Rates Retirements are not expected to lead to demand for new cars in the near-term The coal fleet consists of ~96k hoppers ~102k gondolas 40% 35% 30% 25% 20% 15% 10% Gondolas Hopper Cars 5 Source: Association of American Railroads
Energy Related Cars Returning To Storage Covered Hoppers - Total in Storage Lower frac sand by rail demand has led to significantly larger storage of covered hoppers Tank car storage increased over the last few months due to reduced carloads in crude oil, ethanol, and refined products 180,000 160,000 140,000 120,000 100,000 80,000 Tank Cars - Total in Storage 160,000 140,000 120,000 100,000 80,000 6
Liquefied Natural Gas by Rail NPRM, October 24, 2019 PHMSA, June 2020 The current HMRs do not authorize the bulk transport of LNG in rail tank cars LNG production and consumption trends are related to international fuel prices, mainly crude oil, diesel, and coal Between 2010 and 2018, in the United States: the number of facilities increased by 28.7 percent, and the total storage and vaporization capacities increased by 21 and 23 percent, respectively total liquefaction capacity increased by 939 percent due to new LNG export terminals PHMSA and the FRA issued their final rule, allowing the transport of LNG in DOT-113 specification tank cars with enhanced outer tanks of thicker carbon steel Enhanced liquefaction capacity and lack of pipelines could support LNG-by-rail growth 7
Crude Oil Fleet Size & Composition 60,000 DOT 111 CPC-1232 117/120 100% 4% 16% 90% 50,803 50,000 25% 48,920 80% 46% 46% 40,333 40,000 70% 67% 69% 60% 81% 32,361 82% 30,000 50% 25,470 25,307 81% 24,865 40% 74% 21,569 20,000 30% 54% 54% 20% 10,000 33% 31% 10% 19% 14% 3% 2016 1% 2017 0% 0 2013 2014 2015 2018 2019 2Q 2020 2013 2014 2015 2016 2017 2018 2019 2020 Source: Association of American Railroads 8
Ethanol Fleet Size & Composition DOT 111 CPC-1232 117/120 45,000 100% 1% 2% 7% 10% 11% 38,885 40,000 90% 25% 37,676 10% 36,970 80% 36,069 35,000 42% 34,910 34,392 9% 70% 30,734 62% 30,000 68% 27,109 60% 25,000 8% 50% 98% 93% 20,000 88% 81% 40% 5% 15,000 66% 30% 4% 50% 10,000 20% 34% 28% 5,000 10% 0 0% 2013 2014 2015 2016 2017 2018 2019 2Q 2020 2013 2014 2015 2016 2017 2018 2019 2Q 2020 Source: Association of American Railroads 9
Other Flammable Liquids Fleet Size and Composition 111 1232 Pressure 117 60,000 100% 3% 7% 52,870 14% 19% 19% 90% 21% 21% 48,659 17% 24% 50,000 16% 42,84443,321 80% 14% 42,549 41,893 40,934 8% 12% 40,205 15% 13% 11% 18% 70% 40,000 22% 60% 24% 26% 26% 30,000 50% 40% 71% 20,000 66% 66% 61% 30% 54% 47% 42% 20% 40% 10,000 10% 0 0% 2013 2014 2015 2016 2017 2018 2019 2Q 2020 2013 2014 2015 2016 2017 2018 2019 2Q 2020 Source: Association of American Railroads 10
DOT 117J & DOT 120J Fleet Growth 45,000 41,521 40,000 July 2020 - Fleet size increased by 3,878 Cars or 10% from January 2020 35,000 30,000 25,000 20,000 15,000 10,000 5,000 0 Source: Railway Supply Institute 11
DOT 117R Fleet Growth 35,000 32,379 30,000 July 2020 - Fleet size increased by 3,827 Cars or 13% from January 2020 25,000 20,000 15,000 10,000 5,000 - Oct-17 Oct-18 Oct-19 Apr-17 Apr-18 Apr-19 Apr-20 May-17 Jul-17 May-18 Jul-18 May-19 Jul-19 May-20 Jul-20 Aug-17 Sep-17 Nov-17 Dec-17 Aug-18 Sep-18 Nov-18 Dec-18 Aug-19 Sep-19 Nov-19 Dec-19 Mar-17 Mar-18 Mar-19 Mar-20 Jan-17 Feb-17 Jun-17 Jan-18 Feb-18 Jun-18 Jan-19 Feb-19 Jun-19 Jan-20 Feb-20 Jun-20 Source: Railway Supply Institute 12
Over 59,000 Tank Cars Require Replaced/Retrofit Impacted Fleets by Compliance Dates Based on 2nd Quarter 2020 numbers, the number of cars that need to be Replaced/Retrofit to DOT-117J or DOT-117R by Service/Date 2023 Ethanol All DOT-111 9,635 1,062 Non-Jacketed CPC-1232 2025 52,890 tank cars will need to be retrofitted/replaced in the North American fleet 4,808 Crude Oil, Ethanol Jacketed CPC-1232 2029 37,385 Other Flammable Liquids Packing Group II & III 13
Cars per Month Required vs. Last Month Actual Production Production Cars / Month Cars/Month to Meet Deadlines 492 - 678 DOT-117 Production Avg. Last 3 Months 625 DOT-117R Production Avg. Last 3 Months 762 Total Production Last 3 MonthsAverage 1,387 Surplus Production 402 - 587 14

