Raman Spectroscopy Basics and Applications
Explore the fundamentals of Raman spectroscopy, a valuable analytical technique complementary to IR spectroscopy. Learn about the principles, types of Raman scattering, active Raman vibrations, and how Raman spectra differ from IR spectra. Discover the unique capabilities and applications of Raman spectroscopy in chemical analysis and research.

Download Presentation

Please find below an Image/Link to download the presentation.
The content on the website is provided AS IS for your information and personal use only. It may not be sold, licensed, or shared on other websites without obtaining consent from the author. If you encounter any issues during the download, it is possible that the publisher has removed the file from their server.
You are allowed to download the files provided on this website for personal or commercial use, subject to the condition that they are used lawfully. All files are the property of their respective owners.
The content on the website is provided AS IS for your information and personal use only. It may not be sold, licensed, or shared on other websites without obtaining consent from the author.
E N D
Presentation Transcript
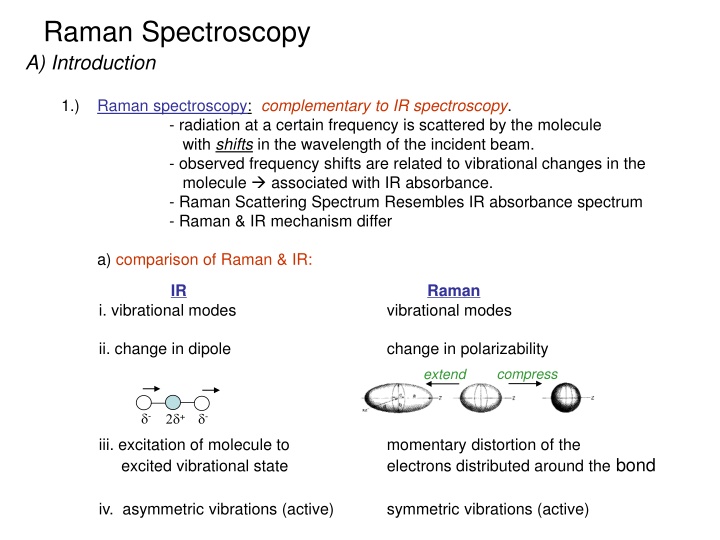
Raman Spectroscopy A) Introduction 1.) Raman spectroscopy: complementary to IR spectroscopy. - radiation at a certain frequency is scattered by the molecule with shifts in the wavelength of the incident beam. - observed frequency shifts are related to vibrational changes in the molecule associated with IR absorbance. - Raman Scattering Spectrum Resembles IR absorbance spectrum - Raman & IR mechanism differ a) comparison of Raman & IR: IR i. vibrational modes Raman vibrational modes ii. change in dipole change in polarizability compress extend - + - iii. excitation of molecule to excited vibrational state momentary distortion of the electrons distributed around the bond symmetric vibrations (active) iv. asymmetric vibrations (active)
2.) Basic Principals of Raman Spectroscopy: - light is scattered by the sample at various angles by momentary absorption to virtual state and reemission No change in electronic states Infinite number of virtual states energy absorbed by molecule from photon of light not quantized
- some scattered emissions occur at the same energy while others return in a different state Raman Scattering net change in energy h in <> h out Rayleigh Scattering no change in energy h in = h out Elastic: collision between photon and molecule results in no change in energy Inelastic: collision between photon and molecule results in a net change in energy
Two Types of Raman Scattering Anti-Stokes: E = h + E Stokes: E = h - E E the energy of the first vibration level of the ground state IR vibration absorbance Raman frequency shift and IR absorption peak frequency are identical
- Resulting Raman Spectrum Lower energy higher energy Probability of Emission Observed Intensity Raleigh scattering >> Stokes >> anti-Stokes difference in population of energy levels of vibrational transitions Intensity of Raman lines are 0.001% intensity of the source
3.) Active Raman Vibrations: - need change in polarizability of molecule during vibration - polarizability related to electron cloud distribution example: O = C = O IR inactive Raman active O = C = O IR active Raman inactive IR & Raman are complimentary. Can be cases where vibration is both IR & Raman active (eg. SO2 non-linear molecule) O In general: C IR tends to emphasize polar functional groups (R-OH, , etc.) Raman emphasizes aromatic & carbon backbone (C=C, -CH2-, etc.) - Raman does not see many common polar solvents can use with aqueous samples advantage over IR Raman frequency range: 4000 -50 cm-1(Stokes and anti-stokes)
4.) Instrumentation: - Basic design
4.) Instrumentation: i. ) Light source: - generally a laser to get required intensity of light for reasonable S/N Raman scattering is only 0.001% of light source - Doesn t have to be in IR region, since look at changes around central peak. visible source used because of high intensity allows use of glass/quartz sample cells & optics UV/Vis type detectors (photomultiplier tubes)
4.) Applications: a) Qualitative Information i. characteristic regions for different groups as in IR ii. Raman correlation charts available iii. Good for aqueous based samples iv. Useful for a variety of samples, organic, inorganic & biological b) Quantitative Information not routinely used i. fewer technical problems than IR, fewer peaks ii. Interference from fluorescence iii. Higher cost iii. Signal weak require modified Raman methods 1) Resonance Raman spectroscopy allows detection of 10-3 ->10-7M by using lasers light with wavelength approaching electronic absorption 2) Surface enhanced Raman spectroscopy places samples on metal or rough surfaces that increase Raman scattering
Locating Landmines with SERS Roughened Au ex = 785 nm Sylvia, J. M. et al. Anal. Chem. 2000, 72,5834.
Locating Landmines with SERS 115 mW 30 sec TNT DNT DNB Sylvia, J. M. et al. Anal. Chem. 2000, 72,5834.
MWCNT/Pd@TiO2 Posizione delle bande caratteristiche (cm-1) 144 445 610 Rutilo 143 195 395 515 639 Anatasio 213 245 282 320 365 456 502 545 584 Brookite
CeO2-ZrO2 solid solutions Phase diagram Raman spectra Spettri Raman di (1) ZrO2(fase monoclina); (2) CZ20 (fase t); (3) CZ40 (fase t ); (4) CZ60 (fase t ); (5) CZ80 (fase t ); (6) CeO2 (fase cubica)

 Basic Principals of Raman Spectroscopy:")


 Active Raman Vibrations:")

 Instrumentation:")
 Instrumentation:")
 Applications:")