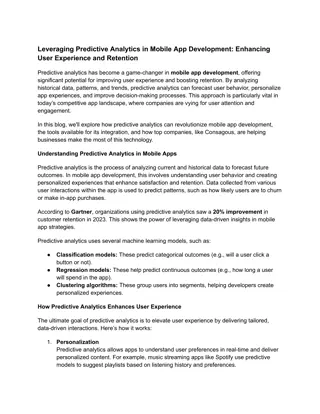
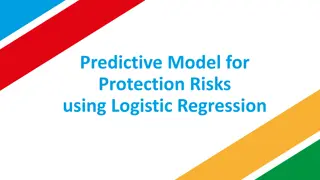
Explore the differences between Random Forest and Logistic Regression in predictive analytics, focusing on their application in institutional research. Discover how these methods are used to predict enrollment outcomes, with insights from a University of Hawai'i study. Dive into the world of predictive analytics and understand its increasing prevalence in higher education research.
Please find below an Image/Link to download the presentation.
The content on the website is provided AS IS for your information and personal use only. It may not be sold, licensed, or shared on other websites without obtaining consent from the author. If you encounter any issues during the download, it is possible that the publisher has removed the file from their server.
You are allowed to download the files provided on this website for personal or commercial use, subject to the condition that they are used lawfully. All files are the property of their respective owners.
The content on the website is provided AS IS for your information and personal use only. It may not be sold, licensed, or shared on other websites without obtaining consent from the author.
E N D
Presentation Transcript
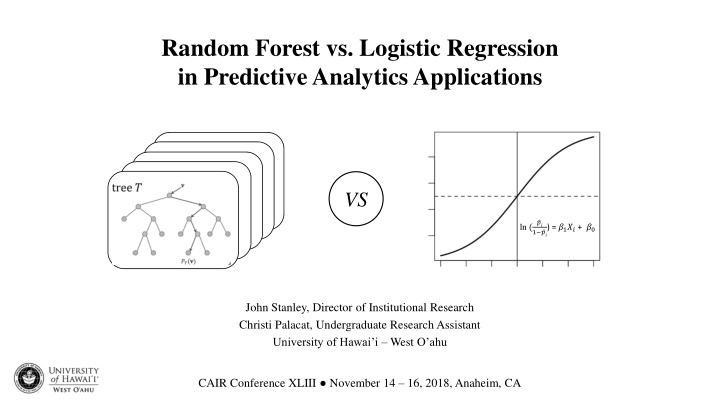
Random Forest vs. Logistic Regression in Predictive Analytics Applications VS ?? 1 ??) = ?1?? + ?0 ln ( John Stanley, Director of Institutional Research Christi Palacat, Undergraduate Research Assistant University of Hawai i West O ahu CAIR Conference XLIII November 14 16, 2018, Anaheim, CA
Predictive Analytics Predictive analytics (PA) increasingly prevalent in institutional research (89% investment according to 2018 AIR/NASPA/Educause survey). First-year retention probably the most common outcome targeted in PA applications. Big data environment driving a proliferation of data mining in PA applications. 2
Todays Objectives Overview the key differences between data mining and inferential statistics, with particular focus on random forest and logistic regression methods. Compare the results from a University of Hawai i study that used random forest and logistic regression methods to predict enrollment outcomes. 3
Relevant Previous Research Astin, A. (1993). What matters in college: Four critical years revisited. Breiman, L. (2001) Random Forests. Machine Learning. Goenner, C. & Pauls, K. (2006). A predictive model of inquiry to enrollment. Research in Higher Education. He, L., Levine, R., Fan, J., Beemer, J., & Stronach, J. (2017). Random forest as a predictive analytics alternative to regression in institutional research. Practical Assessment, Research & Evaluation. Herzog, S. (2005). Measuring determinants of student return vs. dropout/stopout vs. transfer: A first-to-second year analysis of new freshmen. Research in Higher Education. Herzog, S. (2006). Estimating student retention and degree completion time: Decision trees and neural networks vis- -vis regression. New Directions for Institutional Research. Kabacoff, R. (2015). R in action: Data analysis and graphics with R. Pride, B. (2018). Data science: Using data to understand, predict, and improve outcomes. Presented at the 2018 AIR Forum, Orlando, FL. 4
Review of Approaches Inferential Statistics Data Mining Deductive Provides theory first and then tests it using various statistical tools. Process is cumulative. Formalizes a relationship in the data in the form of a mathematical equation. More concerned about data collection. Inductive It explores data first, then extracts a pattern and infers an explanation or a theory. Process is ad hoc. Makes heavy use of learning algorithms that can work semi-automatically or automatically. Less concerned about data collection. Statistical methods applied on clean data. Involves data cleaning. Usually involves working with small datasets or samples of a population. Needs more user interaction to validate model. Usually involves working with large datasets (i.e., Big Data ). Needs less user interaction action to validate model, therefore possible to automate. Makes generous use of heuristics think. There is no scope for heuristics think. Adapted from: https://www.educba.com/data-mining-vs-statistics/ 5
Review of Methods Logistic Regression Random Forest Path analysis approach, uses a generalized linear equation to describe the directed dependencies among a set of variables. A number of statistical assumptions must be met. Top-down induction based approach to classification and prediction. Averages many decision trees (CARTs) together. No statistical assumptions; can handle multicollinearity. Overfitting a concern (rule of ten), as well as outliers. Robust to overfitting and outliers. Final model should be parsimonious and balanced. Final model depends on the strength of the trees in the forest and the correlation between them. Random inputs and random features tend to produce better results in RFs (Breiman, 2001). CART Gini impurity algorithm: A number of complementary measures can be used to assess goodness of fit (i.e., -2LL, ~R2, HL). Logit link function: ln ( 1 ??) = ?1?? + ?0 ?? 6
Research Questions Does random forest produce better classification accuracy than logistic regression when predicting admission yield at a large R1 university? Which method does enrollment management and admissions find easier to interpret? 8
Predictive Analytics Approach to Admission Yield Identify fence sitter non-resident freshmen accepts at peak recruitment season (March 1st) Develop regression and random forest models to predict enrollment likelihood of future cohort Compare/contrast models predictive accuracy, flexibility, interpretability. Enrollment likelihood scoring for admitted non-resident freshmen Automated classification and probability score with SPSS (LR) and R (RF); Decile grouping of scored students and top prospects Reporting of enrollment likelihood via secure online access 9
Data Description Data sources Matriculation system (Banner) Student cohorts New first-time freshmen non-resident admits (University of Hawai i at Manoa) Fall entry 12 , 13 , 14 , 15 , 16 for model dev. (training set, N=16,420) Fall entry 17 for model validation (holdout set, N=4,270); 18% baseline yield Data elements at February 1 Contact: expressed interest, number of applications Geographic: distance, residency, high yield geog region, high yield high school Geodemographic: geog. region by ethnicity, gender, SES Academic: program of study Timing: date of application days/weeks until semester start Financial: FAFSA submitted 10
Data Management Tasks Exploratory data analysis Variable selection (bivariate correlation on outcome variable) Variable coding (continuous vs. dummy/binary (LR) vs. columnar form (RF)) Missing data imputation Derived variable(s) HSPrep = (HSGPA*12.5)+(ACTM*.69)+(ACTE*.69) (not used today) Logistic regression model (SPSS) Preliminary model fit (-2LL test/score, pseudo R2, HL sig.) Refine model fit with forward and backwards elimination of independent variables; choose parsimonious model Check for outliers with diagnostic tools (Std residuals, Cook s D) Check for collinearity (VIF) Check correct classification rate (CCR) for enrollees vs. non-enrollees (i.e., model sensitivity vs. specificity) using baseline probability and Receiver Operating Characteristics (ROC) curve. Make further refinements to cut value. Check for consistency across training sets (stratified sampling) 11
Data Management Tasks Random Forest (R Studio) Set hyperparameters in Random Forest: Number of trees to grow in the forest. Typical values are around 100-500. More trees sometimes leads to overfitting. Number of variables randomly sampled as candidates at each split for a particular tree. Default is # ?? ????????? . Check the out-of-bag (OOB) error rate. Sampling can be done with or without replacement (we set the seed in order to replicate results). Check correct classification rate (CCR) for enrollees vs. non-enrollees (i.e., model sensitivity vs. specificity) using baseline probability and Receiver Operating Characteristics (ROC) curve. Make further refinements to cut value. 12
LR Results from SPSS Nonresident Freshmen Admissions Yield Predictors (LR) Logistic Regression Model Accuracy Enrollment Decision Non-Enrolled Enrolled Overall Accuracy Hosmer-Lemeshow Pseudo R2 Correct Variable 1. No SAT Math Score Reported by Feb 1 2. Completed FAFSA by Feb 1 3. WUE 4. High School GPA- Greater than 3.99 5. SAT Writing- Greater than 660 6. Native Hawaiian 7. High School GPA - Less than 3.00 8. High School GPA - Between 3.67 and 3.99 9. SAT Writing- Less than 500 10. Two or more Previous Contacts 11. Pacific Islander 12. SAT Writing- Between 590 and 660 13. No High School GPA Reported by Feb 1 14. SAT Math -Greater than 660 15. Age 16. Total Grant Amount (per $100) 17. Application Date First Day Instruction Gap Constant Beta -2.937 180.221 0.000 1.231 554.107 0.000 1.022 368.327 0.000 -0.904 122.058 0.000 -0.581 53.141 0.000 0.809 57.059 0.000 0.556 59.945 0.000 -0.456 59.745 0.000 0.453 35.176 0.000 0.444 47.012 0.000 0.427 6.127 0.013 -0.262 26.321 0.000 0.279 13.596 0.000 -0.230 7.501 0.006 0.175 24.210 0.000 0.024 301.859 0.000 -0.014 10.981 0.001 -5.602 71.723 0.000 Wald Sig. Delta P -62% 20% 17% -17% -11% 10% VIF 1.159 1.237 1.173 1.255 1.517 1.017 1.096 1.198 1.127 1.026 1.019 1.337 1.145 1.517 1.019 1.281 1.038 Classification % 80.9 54.5 76.4 P < .000 .274 8% -8% 7% 6% 6% -4% 4% -4% 3% < 1% < 1% First- Time Full-Time Nonresident Freshmen Fall Accepts 12', 13', 14', 15', 16' for model development (training set, N=16,420) ; Fall entry 2017 for model validation (holdout set, N=4,270). Correct classification results are for holdout set. The cut value is .3325. Hosmer-Lemeshow chi-square = 56.565 (p<.000). Delta P statistics are calculated using Cruce's formula for categorical variables and Petersen's formula for continuous variables. 13
RF Results from R version 1, identical dataset as LR Random Forest Model Accuracy Correct Enrollment Decision Non-Enrolled Enrolled Overall Accuracy ROC curve AUC Final cut value used Classification % 83.9 54.4 78.9 0.798 0.290 15
RF Results Version 2 data prepared for RF analysis Random Forest Model v2 Accuracy Correct Enrollment Decision Non-Enrolled Enrolled Overall Accuracy ROC curve AUC Final cut value used Classification % 83.7 42.4 76.7 0.791 0.280 18
Limitations Little collinearity, randomness, or complexity in variables, so perhaps not the best dataset for Random Forest. IVs with low correlation with DV were largely left out of the dataset (since we were approaching this with a regression mindset) but may have otherwise contributed to prediction accuracy in the RF . Imbalanced outcome data could affect RF results. 23
Extensions of Random Forest in IR Freshmen Retention Prediction (UH West O ahu data) Prediction Model Correct Classification Rate (%) Start of Term Start of Term End of Term End of Term Retention Outcome Dropouts Retainees Overall Accuracy Pesudo R2 LR= Logistic Regression; RF= Random Forest (LR) 61.0 61.9 61.6 0.127 (RF) 69.5 61.9 64.2 N/A (LR) 89.9 69.3 75.4 0.398 (RF) 91.1 58.2 67.9 N/A 24
Enrollment Managers Reactions Logistic Regression Felt that the Delta P statistic was highly intuitive. Liked being able to see the directionality in coefficients. Random Forest Finding the cut points for institutional grant aid and total offer amount is operationally useful. Wanted to see a side-by-side comparison of the RF and LR effect scores. 25
Conclusion The random forest model performed at parity with the binomial logistic regression model in terms of prediction accuracy. The level of complexity of the data used and the outcome predicted may largely guide the selection of a particular analytical tool. Random forest may be ideal candidate for estimating time-to-degree where the dataset is more longitudinal in nature (i.e., more complexity and randomness). Conversations with admissions and enrollment management favored the logistic regression analysis as easier to interpret (i.e., goodness of fit stats, Delta P statistic, directionality). 26


")

")
")

")

")
")