Rare Disease Statistics Workshop: ATTR-ACT Study Results Using Finkelstein-Schoenfeld Method
Explore the pivotal results from the ATTR-ACT Phase III Study presented at the 2019 New England Rare Disease Statistics Workshop. Discover how the Finkelstein-Schoenfeld method was used to combine information across multiple endpoints in analyzing Transthyretin Amyloidosis Cardiomyopathy. Gain insights into the study design, simulation, and interpretation of treatment effects, comparing the Finkelstein-Schoenfeld method with traditional approaches. Key takeaways and implications for ATTR-CM management are highlighted.

Download Presentation

Please find below an Image/Link to download the presentation.
The content on the website is provided AS IS for your information and personal use only. It may not be sold, licensed, or shared on other websites without obtaining consent from the author. If you encounter any issues during the download, it is possible that the publisher has removed the file from their server.
You are allowed to download the files provided on this website for personal or commercial use, subject to the condition that they are used lawfully. All files are the property of their respective owners.
The content on the website is provided AS IS for your information and personal use only. It may not be sold, licensed, or shared on other websites without obtaining consent from the author.
E N D
Presentation Transcript
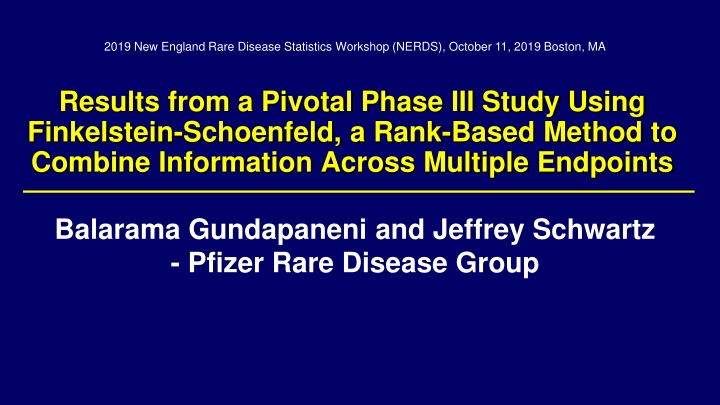
2019 New England Rare Disease Statistics Workshop (NERDS), October 11, 2019 Boston, MA Results from a Pivotal Phase III Study Using Finkelstein-Schoenfeld, a Rank-Based Method to Combine Information Across Multiple Endpoints Balarama Gundapaneni and Jeffrey Schwartz - Pfizer Rare Disease Group
Outline Introduction to ATTR-CM disease and ATTR-ACT Phase 3 Study Introduction of the Finkelstein-Schoenfeld Method Simulation Used in Design of ATTR-ACT ATTR-ACT Study Results Interpretation of the Treatment Effect using Win Ratio Bootstrap results using ATTR-ACT Data comparing Finkelstein-Schoenfeld with Traditional Methods Key Takeaways 2 ATTR-CM = transthyretin cardiomyopathy; ATTR-ACT = The Transthyretin Amyloidosis Cardiomyopathy Clinical Trial;
Transthyretin (TTR) Amyloidosis is a Spectrum of Disease with different and overlapping phenotypes Prevalence of ATTR-CM is approximately 100,000 people in the U.S. and only one to two percent of those patients are diagnosed today Tafamidis approved for ATTR-FAP in Europe in 2011 No approved therapies for ATTR-CM when ATTR-ACT study was being designed 3 ATTR-CM = Transthyretin cardiomyopathy; ATTR-ACT = he Transthyretin Amyloidosis Cardiomyopathy Clinical Trial; ATTR-FAP=transthyretin familial amyloid polyneuropathy
ATTR-ACT Study in Subjects with ATTR-CM International, multicenter, double-blind, placebo-controlled, randomized Phase 3 study Subjects randomized 1:2:2 to 20 mg, 80mg tafamidis, or PBO Stratification for genotype (wild-type and variant) and disease severity (NYHA class) N=441 N=88 Extension Study N=176 N=548 N=177 30-Month mortality status was collected from all subjects, including discontinuations. The primary analysis uses a hierarchical combination applying the method of Finkelstein- Schoenfeld to all cause mortality and frequency of CV related hospitalizations. ATTR-CM = transthyretin cardiomyopathy; ATTR-ACT = The Transthyretin Amyloidosis Cardiomyopathy Clinical Trial; CV=Cardiovascular; NYHA = New York Heart Association; PBO=Placebo 4
Finkelstein-Schoenfeld Analysis1 Method Explained A nonparametric test based on a hierarchical ranking procedure that is a generalization of Gehan Wilcoxon test Each pair of patients are compared with respect to some criteria. The patient who is ranked as better is assigned a score of +1 while the other worse patient is assigned a score of -1. In our study, the hierarchical criteria are mortality followed by frequency of CV related hospitalizations over the period of the clinical trial. The F-S method preserves the higher importance of the mortality endpoint while increasing power and sensitivity by adding a morbidity endpoint 1Finkelstein DM, Schoenfeld DA. Combining Mortality and Longitudinal Measures in Clinical Trials. Statist. Med. 1999; 18; 1341-1354 5
Finkelstein-Schoenfeld Scoring Algorithm Each patient is compared to every other patient (within strata) Scoring is based on hierarchical procedure giving greater weight to mortality Scenario Mortality Survival Time CV Hosp Freq Score 1 D - - -1 A - - +1 2 D L - -1 D H - +1 3 D tied H -1 D tied L +1 4 D tied tied 0 D tied tied 0 5 A - H -1 A - L +1 6 A - tied 0 A - tied 0 6
Finkelstein-Schoenfeld Method Increases Power N=250; 1:1 Randomization 50% reduction in mortality 30% reduction in mortality 8
Operating Characteristics Comparison Finklestein-Schoenfeld Standard Time to Event Hypothesized Effect 30% reduction in mortality, hospitalization frequeny: 2.5 (Placebo), 1.5 (Tafamidis) 30% reduction in mortality Power 90% 90% Sample size 400 1438 (to achieve 271 events) Study Duration 4 years 6 years 9
Regulatory Interaction Clarification on how the ranking will be done in certain scenarios Mortality needs to be directionally favorable to make overall F-S result interpretable Concerns about assumptions of correlation between mortality and CV Hospitalization 10
Finkelstein-Schoenfeld Hypothesis H0: neither all-cause mortality nor frequency of cardiovascular-related hospitalizations is different between the tafamidis and placebo treatment groups. HA: At least one and possibly both all-cause mortality and frequency of cardiovascular-related hospitalizations are different between the tafamidis and placebo treatment groups. 11
ATTR-ACT: Primary Analysis using Finkelstein- Schoenfeld Method Pooled Tafamidis n=264 Placebo n=177 0.0006 P-value 186 (70.5) 101 (57.1) Patients alive1 at Month 30, n (%) Average cardiovascular-related hospitalizations per year among those alive at Month 30 0.297 0.455 1.695 (1.255, 2.289) Win-Ratio2 (95% CI) 1Heart transplant and implantation of a cardiac mechanical assist device were treated as death for this analysis 2Number of pairs of tafamidis-treated patient wins divided by number of pairs of placebo patient wins ATTR-ACT: The Transthyretin Amyloidosis Cardiomyopathy Clinical Trial 12
ATTR-ACT: Analysis of Components 30% reduction in the risk of all-cause mortality (p=0.0259) 32% reduction in the risk of CV-related Hospitalization (p<0.0001) Pooled Tafamidis n=264 Placebo n=177 0.4750 (0.4181, 0.5396) 0.7025 (0.6174, 0.7993) Frequency of CV-related Hospitalizations (95% CI) 0.6761 (0.5639, 0.8107) Relative Risk Ratio (95% CI) <0.0001 P-value ATTR-ACT: The Transthyretin Amyloidosis Cardiomyopathy Clinical Trial ; CV: Cardiovascular 13
Interpretation of the Treatment Effect using Win Ratio1 The Win Ratio test is based on an evaluation of all pairs where every patient in the tafamidis group was compared with every patient in the placebo group within each stratum The Win Ratio is the number of such pairs where the treated patient was ranked better divided by the number of pairs where the placebo patient was ranked better combined across all strata Win Ratio=#of treatment wins/#of placebo wins 1 Pocock SJ, Ariti CA, Collier TJ, et al. The win ratio: a new approach to the analysis of composite endpoints in clinical trials based on clinical priorities. Eur Heart J 2012; 33(2):176-82, Suppl info. 14
The Relationship Between Finklestein-Schoenfeld and Win Ratio Both methods are based on the same scoring process The F-S method calculates a difference The WR method calculates a ratio F-S Difference Numerator in F-S Statistic Win Ratio (95% CI) Tafamidis Wins Placebo Wins Win Ratio 8595 5071 8595-5071 = 3524 1.26 ,2.29 8595/5071 = 1.7 95% CI for Win Ratio Boot Strap Method: A 95% confidence interval is created by calculating the 2.5th and 97.5th percentiles Approximation of standard error for log WR as log Rw z (normal deviate from F-S method) 1 Pocock SJ, Ariti CA, Collier TJ, et al. The win ratio: a new approach to the analysis of composite endpoints in clinical trials based on clinical priorities. Eur Heart J 2012; 33(2):176-82, Suppl info. F-S = Finklestein Schoenfeld 15
Bootstrap Results Comparing Hierarchical Finkelstein- Schoenfeld Method with Traditional Composite Combination 16 FS= Finkelstein-Schoenfeld; CV= Cardiovascular
Comparing Finkelstein-Schoenfeld Method with Traditional Composite Approach Using First CV-Hospitalization FS= Finkelstein-Schoenfeld; CV= Cardiovascular 17
Key Takeaways (1) F-S hierarchical ranking approach improves power and incorporates prioritization of the components of composite outcome. F-S method could reduce sample size requirement enabling studies in rare disease setting which would otherwise not be feasible Regulatory acceptance Tafamidis !! A strong result could help a single well controlled study to secure an approval and potentially an expedited regulatory review (BTD etc). 1 F-S method well suited for fixed duration of follow-up F-S = Finklestein-Schoenfeld 18 1 https://www.accessdata.fda.gov/drugsatfda_docs/nda/2019/211996Orig1s000,%20212161Orig1s000StatR.pdf
Key Takeaways (2) Finkelstein-Schoenfeld method not always suitable Is there reasonable expectation of treatment benefit in the components being considered? What is the relationship between the endpoints when evaluated in a hierarchical fashion? High censoring or missing data in first component of the hierarchy? 19
Acknowledgements Statistician at Boston University Joe Massaro Pfizer Rare Disease Statisticians Dan Meyer Mike Gaffney Michelle Casey Ching Ray 20
,")

 Amyloidosis is a Spectrum of Disease")


")
")