Real Estate Valuation: Chapter Highlights and Definitions

This content explores key concepts in real estate valuation, focusing on cap rates, discount rates, debt yield, and the Cap Rate Universe. Learn about market abstraction, third party estimates, and financial analysis models to make informed investment decisions in the real estate market.

Download Presentation

Please find below an Image/Link to download the presentation.
The content on the website is provided AS IS for your information and personal use only. It may not be sold, licensed, or shared on other websites without obtaining consent from the author.If you encounter any issues during the download, it is possible that the publisher has removed the file from their server.
You are allowed to download the files provided on this website for personal or commercial use, subject to the condition that they are used lawfully. All files are the property of their respective owners.
The content on the website is provided AS IS for your information and personal use only. It may not be sold, licensed, or shared on other websites without obtaining consent from the author.
E N D
Presentation Transcript
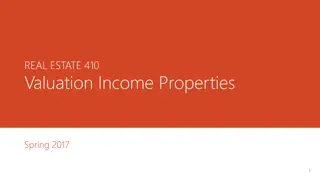
Subjective Real Estate Valuation G. JASON GODDARD
Chapter 6 Outline Chapter Highlights Just a Few Little Numbers Cap Rate Universe Discount Rates Mysteries Revealed Riddle of the Debt Yield
Chapter Definitions Cap rate: The ratio of projected net income relative to sales price. Discount rate: Required rate of return (or rate of interest) for the investor taking into account opportunity costs, inflation, and the certainty of payment. Debt Yield: net operating income divided by the purchase price. From a loan underwriting perspective, it can also be defined as the mortgage constant multiplied by the desired debt service coverage ratio.
Cap Rate Universe Market Abstraction Third Party Market Estimates Band of Investments Lender s Yield Analysis (Gettel) Ellwood s Mortgage Equity J Factor Akerson s K Factor
Cap Rate Universe NOI Value Cap Rate 150,000 3,000,000 $ $ 150,000 3,500,000 $ $ 150,000 4,000,000 $ $ 5.00% 4.29% 3.75% Impact Value Change on Cap Rate
Cap Rate Universe Comparable Listings Subject Property Comparable #1 Comparable #2 Comparable #3 Comparable #4 Comparable #5 Rent psf Cap Rate Price/Unit 0.60 $ 2.12% 1.02 $ 6.15% 1.10 $ 5.06% 0.70 $ 8.06% 1.05 $ 5.85% 0.88 $ 7.00% Min 2.12% Max 8.06% Mean 5.71% Alt 6.42% 92,857 $ 116,389 $ 106,667 $ 93,000 $ 110,000 $ 93,548 $ Market Abstraction for Slick Apartments
Cap Rate Universe 3.5% 75% 20 4.50% 0.0759179 0.0666999 0.0656884 0.0650249 6.57% 6.0% 75% 25 4.50% Y M MTG RATE Rm CR CR = Annual Rate of Yield of Equity on Cash = Loan to Value Percent Ratio = Maximum Available Mortgage Length (Years) = Mortgage Interest Rate = Annual Loan Constant = (M*Rm)+ ((1-M)*Y) = = = = = = = = 6.50% Band of Investments Method
Cap Rate Universe Desired Debt Service Coverage Ratio (DSCR) Loan to Value (LTV) Annual Loan Constant Overall Rate (OAR) 1.25 75% 1.25 75% 0.0759179 0.0666999 7.12% 6.25% Lender s Yield Model (Gettel)
Cap Rate Universe 6.0% 5 75% 20 4.50% 0.0759179 0.1773964 0.1730001 0.0147717 -10% -5% 0.5528322 0.0685559 Y n M MTG RATE Rm 1/Sn P C Appreciation/Depreciation Income Change J Factor Rate = = = = = = = = = = = = = Annual Rate of Yield of Equity on Cash Income Projection Period Loan to Value Percent Ratio Maximum Available Mortgage Length (Years) Mortgage Interest Rate Annual Loan Constant Sinking Fund Factor at Equity Yield Rate Ratio Paid Off-Mortgage Mortgage Coefficient (Y+P1/Sn-RM) Property Change in Value Over Projection Period Change in Income Over Projection Period Adjustment Factor for the Change in Income Over Projection Period Y-MC +/- DEP/APP * 1/Sn 1 + I * J = = = = = = = = = = = = = 6.86% Rate = = Ellwood s Mortgage Equity Method
Cap Rate Universe 6.0% 5 75% 20 4.50% 0.0759179 0.1773964 0.1730001 -10% 0.0666609 Y n M MTG RATE Rm 1/Sn P Appreciation/Depreciation Rate = = = = = = = = = = Annual Rate of Yield of Equity on Cash Income Projection Period Loan to Value Percent Ratio Maximum Available Mortgage Length (Years) Mortgage Interest Rate Annual Loan Constant Sinking Fund Factor at Equity Yield Rate Ratio Paid Off-Mortgage Property Change in Value Over Projection Period (M * Rm) + [(1-M) Y] - M [P (1/Sn)] -DEP/APP (1/Sn) = = = = = = = = = = 6.67% Rate = = Akerson s Mortgage Equity Method
Discount Rate Mysteries Revealed 8.00% 9.00% 10.00% 2,370,000 11.00% 2,270,000 12.00% 2,170,000 Rate Value $ 2,580,000 $ 2,470,000 $ $ $ Impact of Discount Rate Change on DCF Value
Discount Rate Mysteries Revealed Risk Free Rate (rf) Overall Beta for stocks Expected market return (rm) Cost of Equity Capital (Ke) 2.00% US Treasury (normal times) 1.00 Focus on CRE sector 8.00% Long-term market average 8.00% Ke = Rf + Bi (Rm - Rf) 25% Equity Cost of Debt in Market (Kd) Tax Rate of investor (1-t) Cost of Debt (Kd*) WACC 6.00% Borrowing rate today 28.00% 4.32% Kd* = Kd (1-t) 5.24% Discount rate assumption 5.25% Rounded Discount Rate 75% Debt Weighted Average Cost of Capital for Discount Rate
Discount Rate Mysteries Revealed Avg. Discount Rate (IRR) 9.50% 9.30% 9.30% 9.00% 9.38% 9.27% Prior Qtr 10 Yr Treasury 10 Yr Treasury 2.20% 2.10% 2.05% 2.00% 2.68% 2.00% DR Spread Over Avg. CR Spread Over Appreciation Spread Cap Rate 10 Yr Treasury 6.50% 4.30% 6.25% 4.15% 6.50% 4.45% 6.76% 4.76% 6.50% 3.82% 6.00% 4.00% Period Most recent Q1 Most recent Q2 Most recent Q3 Most recent Q4 5 Yr Avg 10 Yr Avg (DR Less CR) 3.00% 3.05% 2.80% 2.24% 2.88% 3.27% 7.30% 7.20% 7.25% 7.00% 6.70% 7.27% Spot 10 Year Treasury Cap Rate Spread Appreciation Spread Discount Rate Rounded DR 2.00% 4.00% 3.27% 9.27% 9.25% Example of Built-Up Method for Discount Rate
Riddle of the Debt Yield 1,000,000 Loan Interest Amortization 5.00% 25 DY 5% 6% 7% 8% 9% 10% 11% 12% 13% 14% 15% NOI 50,000 60,000 70,000 80,000 90,000 100,000 110,000 120,000 130,000 140,000 150,000 ADS 70,151 70,151 70,151 70,151 70,151 70,151 70,151 70,151 70,151 70,151 70,151 DCR 0.71 0.86 1.00 1.14 1.28 1.43 1.57 1.71 1.85 2.00 2.14 Debt Yield vs. Debt Coverage Ratio over 25 years
Riddle of the Debt Yield Loan Interest Amortization 1,000,000 5.00% 20 DY 5% 6% 7% 8% 9% 10% 11% 12% 13% 14% 15% NOI 50,000 60,000 70,000 80,000 90,000 100,000 110,000 120,000 130,000 140,000 150,000 ADS 79,195 79,195 79,195 79,195 79,195 79,195 79,195 79,195 79,195 79,195 79,195 DCR 0.63 0.76 0.88 1.01 1.14 1.26 1.39 1.52 1.64 1.77 1.89 Debt Yield vs. Debt Coverage Ratio over 20 years
Riddle of the Debt Yield Loan Interest Amortization 1,000,000 5.00% 15 DY 5% 6% 7% 8% 9% 10% 11% 12% 13% 14% 15% NOI 50,000 60,000 70,000 80,000 90,000 100,000 110,000 120,000 130,000 140,000 150,000 ADS 94,895 94,895 94,895 94,895 94,895 94,895 94,895 94,895 94,895 94,895 94,895 DCR 0.53 0.63 0.74 0.84 0.95 1.05 1.16 1.26 1.37 1.48 1.58 Debt Yield vs. Debt Coverage Ratio over 15 years
Riddle of the Debt Yield 33 Year View of Interest Rate Lending Indices
Riddle of the Debt Yield 25 20 15 Amortization (years) Mortgage Interest Rate Annual Mortgage Constant Desired Debt Coverage Implied Debt Yield Desired Debt Yield Cushion Implied vs. Desired DY New DY Hurdle Rate Assume LA = NOI/DY and LA = (NOI/DCR)/MC Then NOI/DY = (NOI/DCR)/MC NOI (MC) = NOI (DY)/DCR DCR (MC) = DY 5.00% 7.0151% 1.25 8.7689% 10.00% 1.231% 11.00% 5.00% 7.9195% 1.25 9.8993% 11.8619% 10.00% 0.101% 12.00% 5.00% 9.4895% 1.25 10.00% -1.862% 14.00% Solving for DY Hurdles at various loan amortizations Debt Yield in Terms of DCR
Chapter 6 Questions Questions for Discussion Explain the differences between a capitalization rate and a discount rate. Include how the perception of risk helps determine the final rate selected in each case. Describe the strengths and weaknesses of the debt yield as a lender underwriting metric. Provide examples to show the relationship between a property s cap rate and the perceived risk by the investor. Elaborate on the strengths and weaknesses of the market extraction cap rate derivation model. Provide examples for when the weaknesses are most likely to materialize and elucidate examples of how to rectify this situation. Outline the components of the band of investments cap rate derivation model. Discuss which of these components are most subjective from the perspective of the lender and the investor.
Chapter 6 Questions Questions for Discussion Describe the components of the lender s yield cap rate derivation model. Discuss the strengths and weaknesses of this approach. Describe basic differences between the Ellwood and Akerson cap rate derivation models. In which market situations are these approaches the most and least useful? Explain the differences between the weighted average cost of capital and the built-up method of discount rate estimation. Elaborate on some common other practices for deciding on a discount rate for an investment real estate property. Outline the differences between the debt service coverage ratio and the debt yield. Include strengths and potential for subjectivity in these distinct calculations. Describe how the presence of loan amortization heterogeneity in a lender s loan portfolio can create potential problems when utilizing the debt yield as a loan underwriting metric. Include some possible solutions to this debt yield riddle in your answer.
Chapter 6 Market Vignette Questions for Discussion What is the going in cap rate for this purchase? Given the known data, which cap rate derivation tools can be best utilized for this transaction? What are the limitations of using the cap rate tools in this case? How could these limitations be removed? Elaborate on other methods for deriving a market based cap rate.