Real-Time Data Visualization for Combatting COVID-19 Challenges
Utilizing just-in-time data and real-time data visualization methods to address key challenges posed by the COVID-19 pandemic, such as identifying high-risk individuals, monitoring quarantines, and combating misinformation. Interventions include data entry tools, chat bots, and integration of various data sources to streamline information dissemination and response efforts. Tools such as Python, PHP, and JavaScript are employed to create scalable data products that facilitate a coordinated response to the crisis.

Download Presentation

Please find below an Image/Link to download the presentation.
The content on the website is provided AS IS for your information and personal use only. It may not be sold, licensed, or shared on other websites without obtaining consent from the author.If you encounter any issues during the download, it is possible that the publisher has removed the file from their server.
You are allowed to download the files provided on this website for personal or commercial use, subject to the condition that they are used lawfully. All files are the property of their respective owners.
The content on the website is provided AS IS for your information and personal use only. It may not be sold, licensed, or shared on other websites without obtaining consent from the author.
E N D
Presentation Transcript
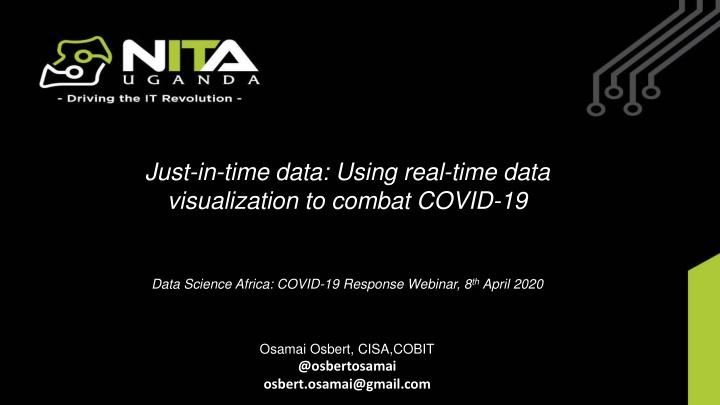
Just-in-time data: Using real-time data visualization to combat COVID-19 NITA-U Budget Framework Paper Data Science Africa: COVID-19 Response Webinar, 8th April 2020 Osamai Osbert, CISA,COBIT @osbertosamai osbert.osamai@gmail.com
THE COVID-19 PROBLEM Points of Entry Identifying high risk persons Test Centers/Labs Reporting of results Monitoring of quarantines and tracing contacts National communication overrun call centers, uncoordinated information, fake news Fragmented data sources/applications Stretched situation room long meetings etc.
INTERVENTIONS Data Entry tools (web/mobile/USSD) and dashboards Tracking PoEs/border points/Arrivals Monitoring contacts Daily tracking of quarantines Chat bot to ease call center traffic Integration of data sources (APIs) limit number of applications Information portals/FAQs/Knowledgebase for call center Fragmented data sources/applications
Take away Quick delivery/Devops Integration of Systems Coordinated teams Scalable data products
Tools Python/Django PHP JavaScript SQL Ionic/Mobile App
Links https://covidadmin.gou.go.ug/ https://covid19.gou.go.ug/ https://health.go.ug