Recovery of U.S. Economy Factors
Explore the date and strength of the recovery of the U.S. economy in 1991, analyzing primary factors like consumption, exports, investment, fiscal and monetary policies, confidence, and more. The synthesis suggests a turnaround time and the influence of subfactors on economic restructuring and recovery periods.

Download Presentation

Please find below an Image/Link to download the presentation.
The content on the website is provided AS IS for your information and personal use only. It may not be sold, licensed, or shared on other websites without obtaining consent from the author. If you encounter any issues during the download, it is possible that the publisher has removed the file from their server.
You are allowed to download the files provided on this website for personal or commercial use, subject to the condition that they are used lawfully. All files are the property of their respective owners.
The content on the website is provided AS IS for your information and personal use only. It may not be sold, licensed, or shared on other websites without obtaining consent from the author.
E N D
Presentation Transcript
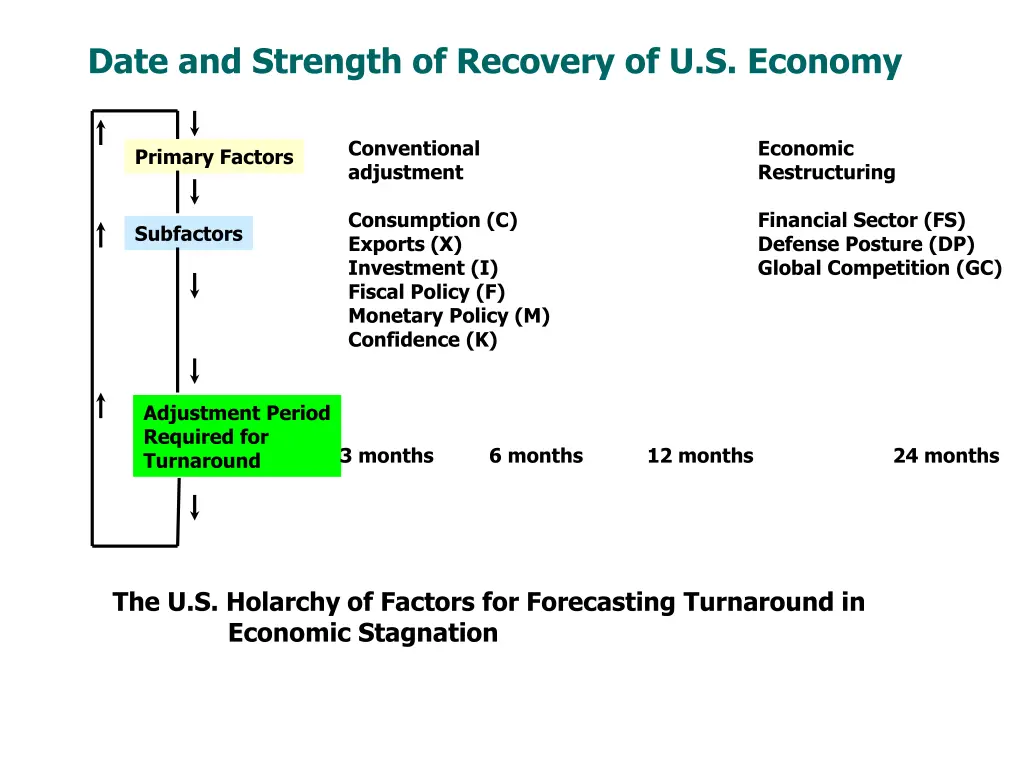
Date and Strength of Recovery of U.S. Economy Conventional adjustment Economic Restructuring Primary Factors Consumption (C) Exports (X) Investment (I) Fiscal Policy (F) Monetary Policy (M) Confidence (K) Financial Sector (FS) Defense Posture (DP) Global Competition (GC) Subfactors Adjustment Period Required for Turnaround 3 months 6 months 12 months 24 months The U.S. Holarchy of Factors for Forecasting Turnaround in Economic Stagnation
Synthesis/Results When the judgments were made, the AHP framework was used to perform a synthesis that produced the following results. First a meaningful turnaround in the economy would likely require an additional ten to eleven months, occurring during the fourth quarter of 1992. This forecast is derived from weights generated in the first column of the limiting matrix in Table 6, coupled with the mid-points of the alternate time periods (so as to provide unbiased estimates: 10.45 months from late December 1991/early January 1992 .224 x 1.5 + .151 x 4.5 + .201 x 9 + .424 x 18 =
Table 1: Matrices for subfactor importance relative to primary factors influencing the Timing of Recovery Panel A: Which subfactor has the greater potential to influence Conventional Adjustment and how strongly? Vector C E I K F M Weights Consumption (C) Exports (E) Investment (I) Confidence (K) Fiscal Policy (F) Monetary Policy (M) 1 1/7 1/5 5 2 5 7 1 5 5 5 7 5 1/5 1 5 3 5 1/5 1/5 1/5 1 1/5 1 1/2 1/5 1/3 5 1 5 1/5 1/7 1/5 1 1/5 1 0.118 0.029 0.058 0.334 0.118 0.343 Panel B: Which subfactor has the greater potential to influence Economic Restructuring and how strongly? Vector FS DP GC Weights Financial Sector Defense Posture Global Competition (GC) (FS) 1 3 3 0.584 (DS) 1/3 1 3 0.281 1/3 1/3 1 0.135
Table 2: Matrices for relative influence of subfactors on periods of adjustment (months) (Conventional Adjustment) For each panel below, which time period is more likely to indicate a turnaround if the relevant factor is the sole driving force? Panel A: Relative importance of targeted time periods for consumption to drive a turnaround 3 6 12 24 Vec. Wts. Panel B: Relative importance of targeted time periods for exports to drive a turnaround 3 6 12 24 Vec. Wts. 3 months 1 1/5 1/7 1/7 .043 6 months 5 1 1/5 1/5 .113 12 months 7 5 1 1/3 .310 24 months 7 5 3 1 .534 3 months 1 1 1/5 1/5 .083 6 months 1 1 1/5 1/5 .083 12 months 5 5 1 1 .417 24 months 5 5 1 1 .417 Panel C: Relative importance of targeted time periods for investment to drive a turnaround 3 6 12 24 Vec. Wts. Panel D: Relative importance of targeted time periods for fiscal policy to drive a turnaround 3 6 12 24 Vec. Wts. 3 months 1 1 1/5 1/5 .078 6 months 1 1 1/5 1/5 .078 12 months 5 5 1 1/3 .305 24 months 5 5 3 1 .538 3 months 1 1 1/3 1/5 .099 6 months 1 1 1/5 1/5 .087 12 months 3 5 1 1 .382 24 months 5 5 1 1 .432 Panel F: Expected time for a change of confidence indicators of consumer and investor activity to support a turnaround in the economy 3 6 12 24 Vec. Wts. Panel E: Relative importance of targeted time periods for monetary policy to drive a turnaround 3 6 12 24 Vec. Wts. 3 months 1 5 7 7 .605 6 months 1/5 1 5 7 .262 12 months 1/7 1/5 1 1/5 .042 24 months 1/7 1/7 5 1 .091 3 months 1 3 5 5 .517 6 months 1/3 1 5 5 .305 12 months 1/5 1/5 1 5 .124 24 months 1/5 1/5 1/5 1 .054
Table 3: Matrices for relative influence of subfactors on periods of adjustment (months) (Economic Restructuring) For each panel below, which time period is more likely to indicate a turnaround if the relevant factor is the sole driving force? Panel A: Financial system restructuring time 3 6 12 24 Vec. Wts. Panel B: Defense readjustment time 3 6 12 24 Vec. Wts. 3 months 1 1/3 1/5 1/7 .049 6 months 3 1 1/5 1/7 .085 12 months 5 5 1 1/5 .236 24 months 7 7 5 1 .630 3 months 1 1/3 1/5 1/7 .049 6 months 3 1 1/5 1/7 .085 12 months 5 5 1 1/5 .236 24 months 7 7 5 1 .630 Panel C: Global competition adjustment time 3 6 12 24 Vec. Wts. 3 months 1 1 1/5 1/5 .078 6 months 1 1 1/5 1/5 .078 12 months 5 5 1 1/3 .305 24 months 5 5 3 1 .538 Table 4: Most likely factor to dominate during a specified time period Which factor is more likely to produce a turnaround during the specified time period? Conventional Adjustment Panel A: 3 Months Panel B: 6 Months Panel C: 1 Year CA Restructuring R Panel D: 2 Years CA R Vec. Wts. CA R Vec. Wts. CA R Vec. Wts. CA 1 5 .833 CA 1 5 .833 CA 1 1 R 1/5 1 .167 R 1/5 1 .167 R 1 1 CA R Vec. Wts. 1/5 .167 CA 1 R 5 1 .833 .500 .500
Table 5: The Completed Supermatrix Conven. Economic. Consum. Adjust Restruc. Exports Invest. Policy Confid. Fiscal Monet. Policy Financ. Sector Defense Posture Global Compet. 3 mo. 6 mo. 1 yr. 2 years 0.833 0.833 0.167 0.167 +-------------------------- 0.500 0.167 Conven. Adjust Economic. 0.0 0.0 Restru. ------+ Consum. 0.118 0.0 Exports 0.029 0.0 Invest. 0.058 0.0 Confid. 0.334 0.0 Fiscal 0.118 0.0 Policy Monetary 0.343 0.0 Policy ------+ +----+ Financ. 0.0 0.584 0.0 Sector Defense 0.0 0.281 0.0 Posture Global 0.0 0.135 0.0 Compet. +----+ +------------------------------------------------------------------+ 3 months 0.0 0.0 0.043 0.083 0.078 0.517 6 months 0.0 0.0 0.113 0.083 0.078 0.305 1 year 0.0 0.0 0.310 0.417 0.305 0.124 2 years 0.0 0.0 0.0 0.0 0.0 0.0 0.0 0.0 0.0 0.0 0.0 0.0 0.500 0.833 0.0 0.0 0.0 0.0 0.0 0.0 0.0 0.0 0.0 0.0 0.0 0.0 0.0 0.0 0.0 0.0 0.0 0.0 0.0 0.0 0.0 0.0 0.0 0.0 0.0 0.0 0.0 0.0 0.0 0.0 0.0 0.0 0.0 0.0 0.0 0.0 0.0 0.0 0.0 0.0 0.0 0.0 0.0 0.0 0.0 0.0 0.0 0.0 0.0 0.0 0.0 0.0 0.0 0.0 0.0 0.0 0.0 0.0 0.0 0.0 0.0 0.0 0.0 0.0 0.0 0.0 0.0 0.0 0.0 0.0 0.0 0.0 0.0 0.0 0.0 0.0 0.0 0.0 0.0 0.0 0.0 0.0 0.0 0.0 0.0 0.0 0.0 0.0 0.0 0.0 0.0 0.0 0.0 0.0 0.0 0.0 0.0 0.0 0.0 0.0 0.0 0.0 0.0 0.0 0.0 0.0 0.0 0.0 0.0 0.0 0.0 0.0 0.0 0.0 0.0 0.0 0.0 0.0 0.0 0.0 0.0 0.0 0.0 0.099 0.605 0.049 0.049 0.089 0.0 0.085 0.089 0.0 0.236 0.209 0.0 0.630 0.613 0.0 0.0 0.0 0.0 0.086 0.262 0.085 0.0 0.0 0.0 0.383 0.042 0.236 0.0 0.0 0.0 0.0 0.534 0.417 0.539 0.054 0.432 0.091 0.630 0.0 0.0 0.0
Table 6: The Limiting Supermatrix Conven. Economic. Consum. Adjust Restruc. Exports Invest. Policy Confid. Fiscal Monet. Policy Financ. Sector Defense Posture Global Compet. 3 mo. 6 mo. 1 yr. 2 years Conven. Adjust Economic 0.0 Restru. 0.0 0.0 0.0 0.516 0.516 0.484 0.484 0.484 0.484 0.484 0.484 0.484 0.484 0.484 0.0 0.516 0.0 0.0 0.0 0.0 0.516 0.516 0.516 0.516 0.516 0.516 0.0 0.0 0.0 0.0 0.0 0.0 Consum. Exports 0.0 0.0 Invest. 0.0 0.0 Confid. 0.0 0.0 Fiscal 0.0 0.0 Policy Monetary 0.0 0.0 Policy Financ. 0.0 0.0 Sector Defense 0.0 0.0 Posture Global 0.0 0.0 Compet. 3 months 0.224 0.224 0.0 6 months 0.151 0.151 0.0 1 year 0.201 0.201 0.0 2 years 0.424 0.424 0.0 0.0 0.0 0.0 0.0 0.0 0.0 0.0 0.0 0.057 0.057 0.057 0.057 0.0 0.0 0.0 0.0 0.0 0.0 0.0 0.0 0.0 0.014 0.014 0.014 0.014 0.0 0.0 0.0 0.0 0.0 0.0 0.0 0.0 0.0 0.028 0.028 0.028 0.028 0.0 0.0 0.0 0.0 0.0 0.0 0.0 0.0 0.0 0.162 0.162 0.162 0.162 0.0 0.0 0.0 0.0 0.0 0.0 0.0 0.0 0.0 0.057 0.057 0.057 0.057 0.0 0.0 0.0 0.0 0.0 0.0 0.0 0.0 0.0 0.166 0.166 0.166 0.166 0.0 0.0 0.0 0.0 0.0 0.0 0.0 0.0 0.0 0.301 0.301 0.301 0.301 0.0 0.0 0.0 0.0 0.0 0.0 0.0 0.0 0.0 0.145 0.145 0.145 0.145 0.0 0.0 0.0 0.0 0.0 0.0 0.0 0.0 0.0 0.070 0.070 0.070 0.070 0.0 0.0 0.0 0.0 0.0 0.0 0.0 0.0 0.0 0.0 0.0 0.0 0.0 0.0 0.0 0.0 0.0 0.0 0.0 0.0 0.0 0.0 0.0 0.0 0.0 0.0 0.0 0.0 0.0 0.0 0.0 0.0 0.0 0.0 0.0 0.0 0.0 0.0 0.0 0.0 0.0 0.0 0.0 0.0 0.0 0.0 0.0 0.0
Conclusion The predicted time of turnaround was 10.45 months from late December 1991/early January 1992, which would have been about November 1992. The consensus of financial experts is that the turnaround of the economy happened about that time.


