Reeb Graphs and Mapper Filters in Data Analysis
Explore the concepts of Reeb graphs and Mapper filters in data analysis, including kNN distance calculation, density measurement, linear transformations, SVD decomposition, and eigenvector extraction from distance matrices.
Download Presentation

Please find below an Image/Link to download the presentation.
The content on the website is provided AS IS for your information and personal use only. It may not be sold, licensed, or shared on other websites without obtaining consent from the author. If you encounter any issues during the download, it is possible that the publisher has removed the file from their server.
You are allowed to download the files provided on this website for personal or commercial use, subject to the condition that they are used lawfully. All files are the property of their respective owners.
The content on the website is provided AS IS for your information and personal use only. It may not be sold, licensed, or shared on other websites without obtaining consent from the author.
E N D
Presentation Transcript
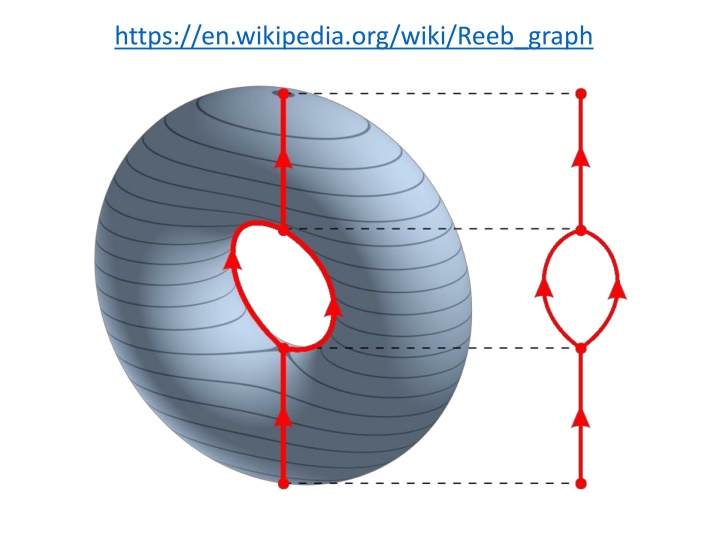
http://www.nature.com/srep/2013/130207/srep01236/full/srep01236.htmlhttp://www.nature.com/srep/2013/130207/srep01236/full/srep01236.html https://en.wikipedia.org/wiki/Reeb_graph
mapper.filters.kNN_distance(data, k, metricpar={}, callback=None) The distance to the k-th nearest neighbor as an (inverse) measure of density. Note how the number of nearest neighbors is understood: k=1, the first neighbor, makes no sense for a filter function since the first nearest neighbor of a data point is always the point itself, and hence this filter function is constantly zero. The parameter k=2 measures the distance from xi to the nearest data point other than xi itself.
mapper.filters.kNN_distance(data, k, metricpar={}, callback=None) The distance to the k-th nearest neighbor as an (inverse) measure of density. Note how the number of nearest neighbors is understood: k=1, the first neighbor, makes no sense for a filter function since the first nearest neighbor of a data point is always the point itself, and hence this filter function is constantly zero. The parameter k=2 measures the distance from xi to the nearest data point other than xi itself. 1(x) = z 2(x) = 5 4 3(x) = x y 3 4(x) =
x y If x is in a denser region than y, then k(x) k(y)
Image of a circle under linear transformation T(x) = Ax where A is a symmetric matrix
https://en.wikipedia.org/wiki/File:Singular-Value-Decomposition.svg The SVD decomposes M into three simple transformations: a rotation V*, a scaling along the coordinate axes and a second rotation U.
mapper.filters.dm_eigenvector(data, k=0, mean_center=True, metricpar={}, verbose=True, callback=None) Return the k-th eigenvector of the distance matrix. The matrix of pairwise distances is symmetric, so it has an orthonormal basis of eigenvectors. The parameter k can be either an integer or an array of integers (for multi-dimensional filter functions). The index is zero-based, and eigenvalues are sorted by absolute value, so k=0 returns the eigenvector corresponding to the largest eigenvalue in magnitude. If mean_center is True, the distance matrix is double-mean- centered before the eigenvalue decomposition. Reference: [R6], subsection Principal metric SVD filters .
