Explore the primary refugee arrivals to Minnesota from various regions of the world, focusing on trends over the years and specific details for the year 2020. This includes insights on the number of arrivals, countries of origin, initial counties of resettlement, and distribution across different months.
Please find below an Image/Link to download the presentation.
The content on the website is provided AS IS for your information and personal use only. It may not be sold, licensed, or shared on other websites without obtaining consent from the author. If you encounter any issues during the download, it is possible that the publisher has removed the file from their server.
You are allowed to download the files provided on this website for personal or commercial use, subject to the condition that they are used lawfully. All files are the property of their respective owners.
The content on the website is provided AS IS for your information and personal use only. It may not be sold, licensed, or shared on other websites without obtaining consent from the author.
E N D
Presentation Transcript
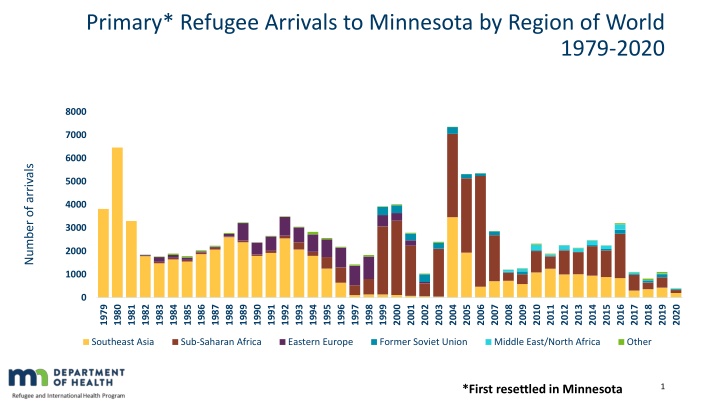
Primary* Refugee Arrivals to Minnesota by Region of World 1979-2020 8000 7000 6000 Number of arrivals 5000 4000 3000 2000 1000 0 1979 1980 1981 1982 1983 1984 1985 1986 1987 1988 1989 1990 1991 1992 1993 1994 1995 1996 1997 1998 1999 2000 2001 2002 2003 2004 2005 2006 2007 2008 2009 2010 2011 2012 2013 2014 2015 2016 2017 2018 2019 2020 Southeast Asia Sub-Saharan Africa Eastern Europe Former Soviet Union Middle East/North Africa Other 1 *First resettled in Minnesota
Primary Refugee Arrivals by Month Minnesota, 2016-2020 450 400 350 300 250 200 150 100 50 0 January February March April May June July August September October November December 2016 2017 2018 2019 2020 2
Primary Refugee Arrivals Minnesota, 2020 Other, 97 (24%) N=400 Burma, 160 (40%) Ukraine, 29 (7%) * Other Cameroon, China, DR Congo, Cuba, Egypt, El Salvador, Eritrea, Guatemala, Honduras, Iraq, Ivory Coast, Liberia, Mexico, Moldova, Nigeria, Sri Lanka, Syria, Togo, Uganda, and Venezuela Afghanistan, 34 (9%) Somalia, 37 (9%) Ethiopia, 43 (11%) 3
Primary Refugee Arrivals by County Lake of the Woods Kittson Roseau Minnesota, 2020 Koochiching Marshall St. Louis Beltrami Pennington Polk Cook Clear Water Red Lake Lake Itasca N=400 Mahnomen Norman Hubbard Cass Becker Clay Aitkin Wadena Crow Wing Carlton Number of Refugee Arrivals By Initial County Of Resettlement Otter Tail Wilkin Pine Todd Mille Lacs Kanabec 0 Grant Douglas Morrison Benton 1 - 10 Stevens Pope Stearns Traverse Isanti Big Stone Sherburne 11 - 30 Chisago Swift Kandiyohi Anoka Wash- ing- ton 71 31 - 100 Meeker Wright Chippewa Ram- sey Hennepin Hennepin 101 - 250 Lac Qui Parle McLeod Carver Renville Yellow Medicine Scott 251 - 500 Dakota Sibley Lincoln Lyon Redwood Rice >500 Goodhue Le Sueur Nicollet Wabasha Brown Pipestone Murray Watonwan Blue Earth Waseca Steele Dodge Olmsted Winona Cottonwood 4 Rock Nobles Jackson Martin Faribault Freeborn Mower Fillmore Houston
Country of Origin by County of Resettlement, Minnesota, 2020 150 40 Burma Ethiopia 30 100 Somalia Afghanistan Liberia 20 Ethiopia Other 50 Somalia 10 Other N=211 N=66 0 0 Ramsey Hennepin 20 20 Ukraine Ethiopia Afghanistan Other 10 Ukraine 10 Other N=36 N=21 0 0 Anoka Dakota 5
Primary Refugee Arrivals Screened in Minnesota 2010 2020 3500 3000 2500 2000 99% 1500 99% 99% 99% 99% 1000 98% 99% 98% 99% 500 98% 98% 0 2010 2011 2012 2013 2014 2015 2016 2017 2018 2019 2020 Arrivals Eligible for Screening 2320 2241 2220 1893 1845 1830 2264 2205 2177 2160 2128 2087 2505 2459 2421 2244 2209 2168 3186 3125 3101 1103 1089 1068 818 787 771 1104 1059 1047 400 382 375 Screened Ineligible if moved out of state or to an unknown destination, no insurance, unable to locate or died before screening 6
Primary Refugees Reasons for No Screening, Minnesota, 2020 No insurance* 4% Contact failed 8% N= 25 Screened elsewhere, no results 12% Unable to locate* 28% Moved out of Minnesota* 16% Refused screening 8% Already connected to care* 24% *Ineligible for the refugee health assessment 7
Refugee Screening Rates by Exam Type Minnesota, 2020 375 / 381 Health Screening Rate 98% 369 / 375 Tuberculosis (TB) 98% Hepatitis B 362 / 375 97% Sexually Transmitted Infections (STIs)* 364 / 375 97% 287 / 375 Intestinal Parasites 77% Lead (<17 yrs old) 151 / 155 97% 0% 10% 20% 30% 40% 50% 60% 70% 80% 90% 100% *Screened for at least one type of STI 8
Health Status of New Refugees, Minnesota, 2020* Number (%) of refugees screened* Number (%) of refugees with infection Health status upon arrival TB (latent or active)** 369 (98%) 55 (15%) Hepatitis B infection*** 362 (97%) 18 (5%) Parasitic infection**** 287 (77%) 60 (21%) Sexually transmitted infections (STIs)***** 364 (97%) 5 (1%) Lead****** 151 (97%) 17 (11%) Hemoglobin 370 (99%) 52 (14%) *Total screened: N=375 (98% of 382 eligible refugees) ** Persons with LTBI ( 10mm induration or IGRA+, normal CXR) or suspect/active TB disease *** Positive for hepatitis B surface antigen (HBsAg) **** Positive for at least one intestinal parasite infection ***** Positive for at least one STI (tested for syphilis, HIV, chlamydia, and/or gonorrhea) ****** Children <17 years old (N=155); lead level 5 g/dL 9
Latent or Active Tuberculosis (TB)* Among Refugees By Region Of Origin Minnesota, 2020 N=369 screened Overall TB Infection 15% 55 / 369 Sub-Saharan Africa 33 / 108 31% SE/East Asia 15 / 197 8% Latin America/Caribbean 2 / 9 22% North Africa/Middle East 4 / 20 20% Europe 3% 1 / 35 0% 5% 10% 15% 20% 25% 30% 35% 40% 45% 50% *Diagnosis of Latent TB infection (N= 51) or Suspect/Active TB disease (N=0) 10
Intestinal Parasitic Infection* Among Refugees by Region of Origin Minnesota, 2020 N=287 screened Overall Parasitic Infection 21% 60 / 287 Sub-Saharan Africa 8% 8 / 97 SE/East Asia 47 / 141 33% Latin America/Caribbean 2 / 7 29% North Africa/Middle East 6% 1 / 17 Europe 8% 2 / 25 0% 5% 10% 15% 20% 25% 30% 35% *At least 1 parasitic infection found via stool or serology (excluding nonpathogenic) 11
Hepatitis B* infection Among Refugees by Region of Origin Minnesota, 2020 N=362 screened Overall Hep B Infection 5% 18 / 362 Sub-Saharan Africa 6 / 110 5% SE/East Asia 12 / 190 6% Latin America/Caribbean 0% 0 / 9 North Africa/Middle East 0 / 20 0% Europe 0 / 33 0% 0% 1% 2% 3% 4% 5% 6% 7% 8% 9% 10% 12
Immunization Status Among Refugees Minnesota, 2002 2020 100 % with Evidence of Immunizations 90 80 70 60 50 40 30 20 10 0 2004 2002 2003 2005 2006 2007 2008 2009 2010 2011 2012 2013 2014 2015 2016 2017 2018 2019 2020 Year Overseas Domestic 13


* Among Refugees By Region")