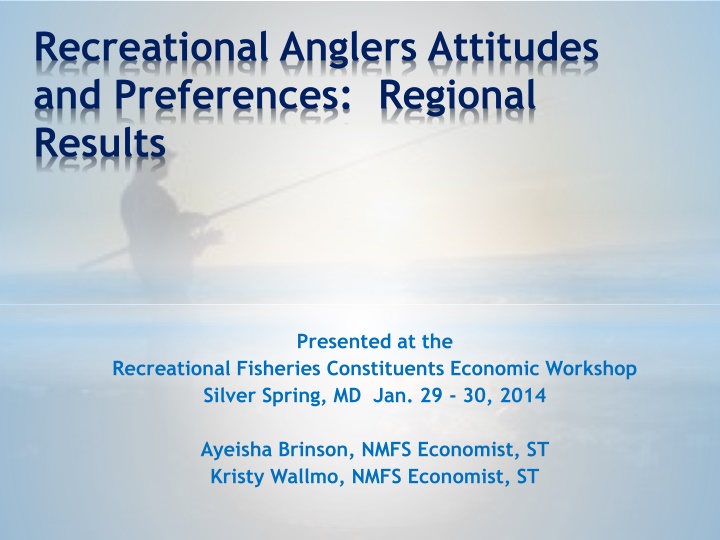
Regional Study on Recreational Anglers' Attitudes and Preferences
Explore the results of a regional study presented at a fisheries economic workshop, focusing on recreational anglers' attitudes, preferences, survey design, sampling, and key findings such as angler avidity and fishing location.

Download Presentation

Please find below an Image/Link to download the presentation.
The content on the website is provided AS IS for your information and personal use only. It may not be sold, licensed, or shared on other websites without obtaining consent from the author. If you encounter any issues during the download, it is possible that the publisher has removed the file from their server.
You are allowed to download the files provided on this website for personal or commercial use, subject to the condition that they are used lawfully. All files are the property of their respective owners.
The content on the website is provided AS IS for your information and personal use only. It may not be sold, licensed, or shared on other websites without obtaining consent from the author.
E N D
Presentation Transcript
Recreational Anglers Attitudes and Preferences: Regional Results Presented at the Recreational Fisheries Constituents Economic Workshop Silver Spring, MD Jan. 29 - 30, 2014 Ayeisha Brinson, NMFS Economist, ST Kristy Wallmo, NMFS Economist, ST
Survey Overview: Design and Implementation *May 2012: Survey development * Input from regional recreational economists and recreational coordinators, constituent groups *June Aug. 2012: * Instrument feedback from constituent groups, MAFAC, four focus groups in Orlando, Fl. and San Diego, CA. *Aug. Sept. 2012: Survey finalized *Sept. 2012 Jan. 2013: PRA Review and approval *Feb. 2013 May 2013: Implementation * Survey implemented 36,362 mailings, 9,226 completed surveys *Six survey sections: *Fishing participation *Preferences for management strategies *Preferences for management objectives *Satisfaction with management *Managing the marine environment *Socio-demographics
Survey Overview: Sampling Design *Stratified design within national framework *Contractor implemented telephone screeners before Segment 2 mailing *Response rates ranged from 21% (Gulf) 38% (North Atlantic)
Survey overview: Differences in Regional Instruments Fishing Location and Target Species
Results: Angler Avidity Alaska West Coast Gulf Coast South Atlantic Mid- Atlantic North Atlantic Years fishing 19.4 29.7 25.1 25.0 32.2 30.0 Days fished last year 10.9 18.3 28.6 24.3 29.5 24.4 Fishing trips will decrease next year* 32.1 21.5 20.3 17.1 20.5 16.0 Decrease due to* fisheries regulations 20.0 46.8 50.3 42.0 44.7 42.9 fishery conditions 33.3 51.9 25.5 33.1 47.3 46.9 fishing trip costs 70.3 60.0 59.6 64.3 68.3 63.0 personal finances 61.5 50.0 51.4 53.3 59.0 55.0 change of residence 15.2 15.9 12.9 15.2 11.2 10.8 available leisure time 51.6 50.6 52.0 55.3 55.0 59.0 *Respondents stating Very likely or Somewhat likely
Results: Fishing location and mode Alaska West Coast Gulf Coast South Atlantic Mid- Atlantic North Atlantic During the last year, most fishing trips taken Within 3 miles from shore 72 75 78 86 86 85 More than 3 miles from shore 24 23 21 12 12 12 During the last year, most fishing trips taken from Private boat 43 54 56 46 52 48 Shore (beach, bridge, pier, jetty) 20 27 31 50 40 47 For-hire vessel 37 19 5 4 8 4
Preferences for Management Strategies A. Establish minimum size limits of the fish you can keep B. Establish maximum size limits of the fish you can keep C. Limit the total number of fish you can keep D. Manage some species as catch-and-release only E. Establish longer seasons with more restrictive bag limits F. Establish shorter seasons with less restrictive bag limits G. Establish shorter seasons with a larger variety of species you can legally catch H. Increase the recreational harvest limit by decreasing the commercial harvest limit I. Divide the recreational harvest limit among different modes (e.g., private anglers and for-hire/charter boat anglers) J. Restrict certain types of fishing gear K. Require the use of release techniques that reduce fish mortality L. Provide artificial fish habitat (e.g., artificial reef) in some areas of the ocean M. Protect and restore fish habitat that has been degraded N. Designate some areas of the ocean as marine reserves with catch-and-release only fishing O. Close some areas of the ocean for certain seasons
Most Preferred Management Strategies 200% 175% 150% Limit total keep 125% Provide artificial habitat Increase rec harvest/decrease comm. harvest 100% Require release techniques to reduce mortality 75% Establish minimum size limits Protect/restore degraded fish habitat 50% 25% 0% Alaska Gulf Coast North Atlantic West Coast South Atlantic Mid-Atlantic
Least Preferred Management Strategies 200% 175% 150% Divide rec. harvest limit among fishing modes 125% Close areas for certain seasons 100% Longer seasons/more restric. bag limits Shorter seasons/larger variety species legal to catch 75% Shorter seasons/less rest. bag limits 50% 25% 0% Alaska Gulf Coast North Atlantic West Coast South Atlantic Mid-Atlantic
Preferences for Management Objectives A. Ensure that large quantities of fish are available to catch B. Ensure that many different fish species are available to catch C. Ensure that adequate numbers of trophy-sized fish are available to catch D. Reduce the mortality associated with releasing fish that are not legal to keep E. Ensure that future generations will have high quality fishing opportunities F. Allocate some quota from commercial fisheries to recreational fisheries G. Recover fish stocks that have been depleted H. Protect marine biodiversity I. Protect threatened or endangered marine species J. Achieve consistency between state and federal fishing regulations K. Simplify recreational fishing regulations L. Monitor and enforce recreational fishing regulations M. Ensure that the opinions of all recreational fisheries stakeholders are considered in policy-making N. Ensure opportunities to fish in high quality fishing areas O. Ensure that fishing sites are not heavily congested
Most Important Management Objectives 250% 200% 150% Protect T&E marine species Recover depleted fish stocks Ensure future generations high quality fishing 100% 50% 0% Alaska Gulf Coast North Atlantic West Coast South Atlantic Mid-Atlantic
Least Important Management Objectives 30% 20% Protect T&E marine species Ensure large quantities of fish Ensure fishing sites not congested Allocate comm. quota to rec. fisheries Adequate number of trophy fish 10% 0% Alaska Gulf Coast North Atlantic West Coast South Atlantic Mid-Atlantic
Satisfaction with Management A. Managing fish stocks to provide high quality fishing opportunities B. Restoring fish stocks that have been depleted C. Adjust regulations in a timely manner to address changing conditions of the fishery D. Using management strategies that minimize costs to anglers E. Ensure that the annual harvest limit provides enough fish for recreational fisheries F. Ensure that state and federal regulations are consistent G. Monitoring and enforcing recreational fishing regulations H. Using high quality data and assessments in policy-making I. Incorporating stakeholder interests in policy-making J. Protecting fish or shellfish species that are declining K. Protecting marine habitats L. Addressing conflicts between anglers and marine mammals
120% Most Satisfied with Management 100% 80% Manage stocks to provide high quality fishing opps Monitor/enforce recreational regs 60% Protecting declining fish/shellfish species Ensure harvest limits provide sufficient fish for rec. fishing Protecting marine habitat 40% 20% 0% Alaska Gulf Coast North Atlantic West Coast South Atlantic Mid-Atlantic
Least Satisfied with Management 45% 40% 35% Ensure harvest limits provide sufficient fish for rec. fishing 30% Protect declining fish/shellfish species Monitor/enforce recreational regs 25% Address angler/mammal conflicts 20% Use high quality data Incorporate stakeholder interests 15% Ensure consistency btw state/federal regs 10% 5% 0% Alaska Gulf Coast North Atlantic West Coast South Atlantic Mid-Atlantic
Next steps *National report done *http://www.st.nmfs.noaa.gov/human dimensions/social-indicators/index *Regional reports in development *Need input from regional coordinators on recent policy actions