Regression Analysis and Panel Data Models: Understanding Statistical Techniques
Delve into the world of statistical analysis with regression analysis and panel data models. Learn how independently pooled cross-sections offer valuable insights, while panel data accounts for heterogeneity and unobserved effects to enhance data analysis and interpretation.
Download Presentation

Please find below an Image/Link to download the presentation.
The content on the website is provided AS IS for your information and personal use only. It may not be sold, licensed, or shared on other websites without obtaining consent from the author. If you encounter any issues during the download, it is possible that the publisher has removed the file from their server.
You are allowed to download the files provided on this website for personal or commercial use, subject to the condition that they are used lawfully. All files are the property of their respective owners.
The content on the website is provided AS IS for your information and personal use only. It may not be sold, licensed, or shared on other websites without obtaining consent from the author.
E N D
Presentation Transcript
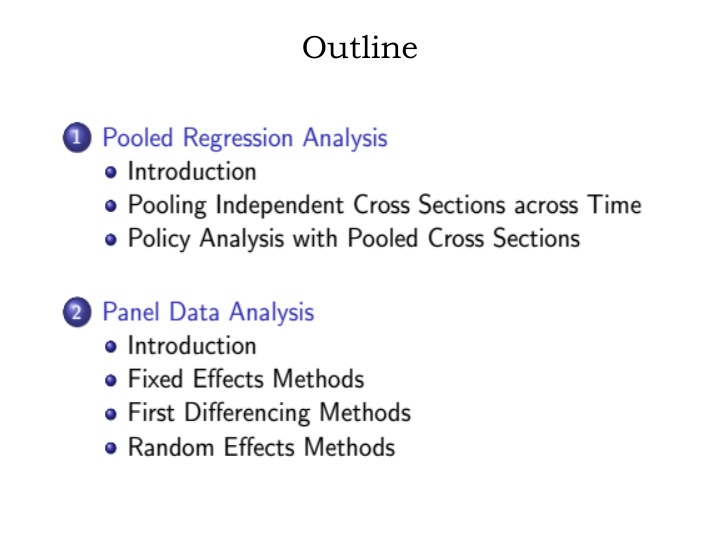
Pooled regression analysis Introduction: An independently pooled cross section is obtained by sampling randomly from a population at different points in time. Such a data set has an important feature from statistical point of view in the sense that it consists of independently sampled observations. It has to be distinguished from panel data or longtidunal data which is a record of data over time across the same units of the sample. In the case of pooled data, individual units on which data is collected do not have to be the same. One reason for using independently pooled cross sections is to increase the sample size.
Pooled regression analysis By pooling random samples drawn from the same population at different point in time, we can get more precise estimators and test statistics with more power. Pooling is helpful only if the relationship between the dependent variable and at least some of the independent variables remain constant over time. Standard estimation techniques such as OLS are applicable. The fact that the population may have different distribution can be handled by allowing the intercept to differ using time dummies. The pattern of coefficients of the time dummies might be of interest in itself: example includes women s fertility over time, and changes in the return to education
Panel Data A dimensions Some of the advantages of panel data (also called longitudinal data) are : It explicitly accounts for heterogeneity across individual units. It helps capture cross-section specific attributes and time series It gives more variability, more degrees of freedom, less collinearity among covariates, and more efficiency. It minimizes the bias caused by aggregation in pure time series data. An important motivation for panel data models is heterogeneity panel data combines cross-sectional and time series
Panel Data A major aspect in the formulation and estimation of panel data model is whether there is unobserved heterogeneity which is correlated with the covarate(s). In the presence of unobserved heterogeneity that is believed to have been correlated with one or more of the covariates, fixed effects model is used. In fact, this is one way of dealing with endogeneity problem. An alternative specification of the panel data model with the assumption that there is no correlation between the unobserved effects and the covariate(s) is the random effects model


