Regression Analysis in Budget Allocations
Explore the use of regression analysis in departmental budget allocations, including its methodology, results, and importance in understanding institutional cost structures. Learn about the evolution of resource allocation in academia and key variables cited in budgeting decisions. Delve into the Delaware Study for insights into instructional resource management in higher education.

Download Presentation

Please find below an Image/Link to download the presentation.
The content on the website is provided AS IS for your information and personal use only. It may not be sold, licensed, or shared on other websites without obtaining consent from the author. If you encounter any issues during the download, it is possible that the publisher has removed the file from their server.
You are allowed to download the files provided on this website for personal or commercial use, subject to the condition that they are used lawfully. All files are the property of their respective owners.
The content on the website is provided AS IS for your information and personal use only. It may not be sold, licensed, or shared on other websites without obtaining consent from the author.
E N D
Presentation Transcript
Using Regression Analysis in Departmental Budget Allocations Andrew L. Luna, University of North Alabama Kelly A. Brennan, The University of Alabama
Contents of Discussion General information about budget allocations Regression Analysis what is it and how it is used in this process Methodology Results of the analysis, how the results where used, and recommendations
Didnt get a paper? For a copy of this presentation/paper alluna@una.edu kbrennan@bama.ua.edu
Importance of Budget Process Offers thorough understanding of the institutions cost structure for long range planning Increases awareness of strengths and weaknesses Effective budgeting models enables institutions to evaluate the changing institutional environment
Evolution of Resource Allocation Focused on departments within colleges across the university (1980 s) Faculty performance in relation to departmental productivity (1990 s) Distribution of scarce resources across the university (2000) (Casper/Henry, 2006; Middaugh, 2001; Santos 2007)
Departmental Information Departmental activities are personnel intensive Instructional costs account for 40% of educational expenditures Need to account for decentralized management system
Variables often Cited Faculty FTE Number of Majors/Grad Students Credit Hour Production Number of Degrees Awarded Equipment Faculty Rank
Delaware Study Documents instructional and educational expenditures at an academic discipline level of analysis since 1992 Offers insights to how higher education on a macro level is managing and allocating instructional resources Focuses on productivity of faculty based on the cost per credit hour
Market Influence on Salary Strategic decisions involve the evaluation of both internal and external environments (Constantin & Lusch, 1994) Incorporate discipline specific average faculty salary Accounts for differences in departmental budgets & assists in planning/decision- making
Annual Budget Process In February, all Academic Departments submit their budget request to the dean of the college in which they reside. In March, each dean meets with the Vice President to discuss college allocation. Based upon this information, the Vice President presents his allocation to the colleges.
The VPAA Wanted to Know. Is there a quantitative method to help in this decision process? If a method is found can it be unbiased/equitable? Will the people and departments affected be able to understand the quantitative model?
There are lies, damned lies, and statistics. Mark Twain Statistical models can help explain phenomena, but they are not a sliver bullet and they are not perfect It is important to effectively communicate the methodology behind the models and to educate when necessary
Statistical Planning The Complete Approach Discussion
Regression Analysis Around the turn of the century, geneticist Francis Galton discovered a phenomenon called Regression Toward The Mean. Seeking laws of inheritance, he found that sons heights tended to regress toward the mean height of the population, compared to their fathers heights. Tall fathers tended to have somewhat shorter sons, and vice versa. y x
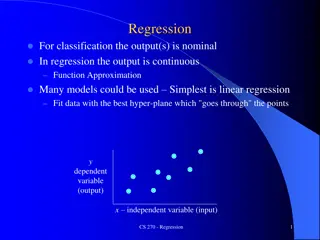
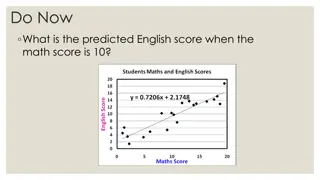
Predictive Versus Explanatory Regression Analysis Prediction to develop a model to predict future values of a response variable (Y) based on its relationships with predictor variables (X s) Explanatory Analysis to develop an understanding of the relationships between response variable and predictor variables
Problem Statement A regression model will be used to try to explain the relationship between departmental budget allocations and those variables that could contribute to the variance in these allocations. . . , , Bud Alloc x x x ix 1 2 3
Simple Regression Model y Predicted Values Residuals Y = ir Y i i Slope Actual Values x
Multiple Regression Model Y X1 X2
The First Model - Variables Total Departmental Budget (Dependent) Number of full-time professors Number of majors Total degrees conferred Total credit hours generated Total credit hours generated by majors Total lower-level credit hours generated Total upper-level/grad. Hours generated Delaware cost per credit hour Market value of the discipline
Marketability Explained Area Dept 1 Dept 2 Dept 3 Dept 4 Dept 5 Dept 6 Dept 7 Average Mean Salaries Ratio Variable Used 65,423 52,142 71,417 50,758 48,775 57,331 58,155 57,714 1.13 0.90 1.24 0.88 0.85 0.99 1.01
Interactions In addition to observing main effects from each IV, various interactions were observed Interaction occurs when the magnitude of the effect of one IV (X) on DV (Y) varies as a function of a second IV (Z) The interaction term is simply the product of two variables
Centering Variables Centering variable used in interactions increases the interpretability and strength of the interaction Centering is the process of subtracting the mean from a variable, leaving deviation scores
Results of Complete Model Average budget allocation for the 28 departments = $952,786. The Max = $2,008,792 and the Min = $310,468 F Statistic = 26.59 (.0001) R-Squared - .9708 Standard Deviation of the unexplained budget allocation (Root MSE) = $97,690
Parameter Estimates of Complete Model Parameter Estimate Pr > |t| Parameter Estimate Variable Variable Pr > |t| INTERCEPT -526733 0.0905 MARKET 847717 0.0065 PROF 44104 <.0001 DELAWARE 117005 0.1767 MAJORS -228.63457 0.4183 PROF*MAJORS -55.2971 0.4946 DEGREES -1480.0107 0.6309 PROF*DEGREES -283.4041 0.4133 MAJCHRS 17.5550 0.6959 MAJORS*DEGREES 3.4660 0.2394 CHRS -71.6280 0.5198 CHRS*PROF -2.2653 0.0226 LLUG 89.7550 0.4350 PROF*MAJCHRS 6.8917 0.5660 ULUG_GRD 36.7241 0.7161 CHRS*DEGREES 0.3978 0.0340
R-Square and Independent Variable Contribution To Budget Allocation PROF MARKET R-Square increases with each new variable UG_MAJ CHRS GR_MAJ
Results of Selected Model F Statistic = 66.04 (.0001) Adjusted R-Squared - .9497 Standard Deviation of the unexplained budget allocation (Root MSE) = $96,942
Parameter Estimates of Selected Model Parameter Estimate Variable Pr > |t| Intercept -544842 0.0027 PROF 43586 <.0001 CHRS 9.4536 0.1474 DEGREES -1346.6 0.2206 MARKET 842966 <.0001 CHRS*DEGREES 0.20361 0.0104 CHRS*PROF -1.48669 0.002
What do the Parameter Estimates Mean for Main Effects? Variance in 1 professor increases/decreases the budget estimate an average of $43,586 Variance in 1/10 in the marketability ratio increases/decreases the budget estimate an average of $84,296
What do the Parameter Estimates Mean for the Interactions? Variance in 1 credit hour increases/decreases the budget estimate an average of 20 cents for a department with an average number of degrees conferred Variance in 1 faculty member increases/decreases the budget estimate an average of $1.50 for a department with an average number of credit hours
Outcome Turn to page 15 in the Paper
So, What Happened? The VPAA reviewed the model along with the departmental budget requests He used the model to identify those departments that were either significantly under funded or over funded VPAA made adjustments to budget allocations based in part upon the model
Recommendations Run the model every year and compare to previous years Larger universities may want to include research, distinguished faculty, or differentiate medical, law, and dental schools from other programs Research other factors that may influence budget allocation