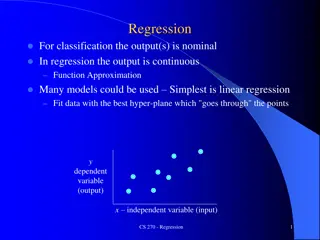
Regression Techniques for Predictive Analytics
Explore regression techniques for predictive analytics in this comprehensive guide. Learn about linear, quadratic, logistic, and non-linear regression models, their applications, and where they are used. Discover the impact of regression in various sectors and gain insights into advanced analytics technologies.

Uploaded on | 0 Views
Download Presentation

Please find below an Image/Link to download the presentation.
The content on the website is provided AS IS for your information and personal use only. It may not be sold, licensed, or shared on other websites without obtaining consent from the author. If you encounter any issues during the download, it is possible that the publisher has removed the file from their server.
You are allowed to download the files provided on this website for personal or commercial use, subject to the condition that they are used lawfully. All files are the property of their respective owners.
The content on the website is provided AS IS for your information and personal use only. It may not be sold, licensed, or shared on other websites without obtaining consent from the author.
E N D
Presentation Transcript
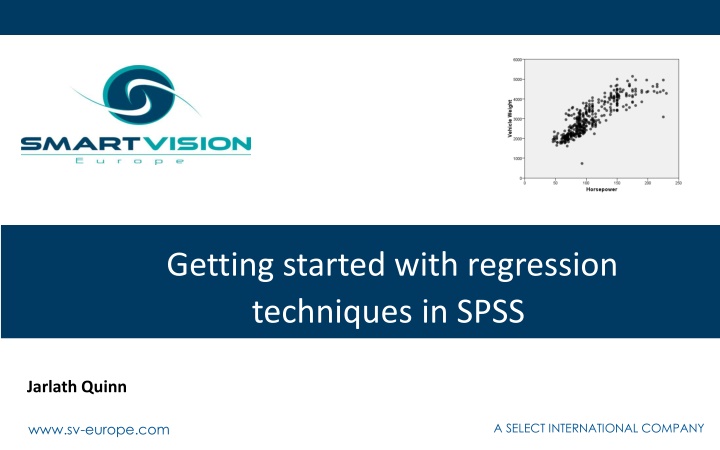
Getting started with regression techniques in SPSS Jarlath Quinn www.sv-europe.com A SELECT INTERNATIONAL COMPANY
Just waiting for all attendees to join Getting started with regression techniquesin SPSS Jarlath Quinn www.sv-europe.com A SELECT INTERNATIONAL COMPANY
FAQs Is this session being recorded? Yes Can I get a copy of the slides? Yes, we ll email links to download materials after the session has ended. Can we arrange a re-run for colleagues? Yes, just ask us. How can I ask questions? All lines are muted so please use the chat panel if we run out of time we will follow up with you. A SELECT INTERNATIONAL COMPANY
Deep experience of applied advanced Premier accredited partner to IBM, Predictive analytics applications across sectors Retail Gaming Utilities Insurance Telecommunications Media FMCG Solutions and DataRobot specialising in advanced analytics & big data technologies Work with open source technologies (R, Python, Spark etc.) Team each has 15 to 30 years of experience working in the advanced and predictive analytics industry A SELECT INTERNATIONAL COMPANY
Agenda Overview of regression techniques and linear relationships Performing a Simple Linear Regression Using Multiple Linear Regression to make predictions Predicting response probability with Logistic Regression A SELECT INTERNATIONAL COMPANY
What do we mean by Regression? A family of statistical techniques used to predict outcomes and generate estimates for hundreds of applications Linear Regression is used when the outcome is continuous (or scale) data the relationships between the fields can be described using straight lines Quadratic Regression Is a variant of Linear Regression when the outcome is continuous the relationship with the dependent variable is curvilinear Logistic Regression is used When the outcome consists or 2 (or more) categories Non-Linear regression is commonly used when the target relates to growth or a power law A SELECT INTERNATIONAL COMPANY
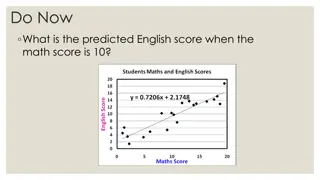
Where are Regression Techniques Used Modelling the relationship between promotion spend and revenue Estimating pollution levels following heavy rainfall Predicting tourism revenue based on exchange rates and air travel costs Predicting student test scores based on previous test results and peer-group performance Estimating website hits based on re-tweets and follower numbers Predicting sales of barbeques based on temperature forecasts A SELECT INTERNATIONAL COMPANY
Regression to the Mean A SELECT INTERNATIONAL COMPANY
Regression to the Mean *jittered points A SELECT INTERNATIONAL COMPANY
Regression to the Mean A SELECT INTERNATIONAL COMPANY
Regression to the Mean A SELECT INTERNATIONAL COMPANY
Regression to the Mean } The regression line is drawn so it that minimises the differences between the points and line itself ( this is called the line of least squares) A SELECT INTERNATIONAL COMPANY
Regression to the Mean * But be careful It is just an average after all *Anscombe s Quartet A SELECT INTERNATIONAL COMPANY
Measuring Linear Relationships 0.434 0.859 -.701 Pearson Correlation Values A SELECT INTERNATIONAL COMPANY
Non-Linear Relationships -.671 -0.005 Pearson Correlation Values A SELECT INTERNATIONAL COMPANY
Correlations as Percentages Correlation = 0.859 0.859 x 0.859 = 0.738 0.738 = 73.8 % Correlation Squared = R Square 73.8% A SELECT INTERNATIONAL COMPANY
From Correlation to Prediction How can we express linear relationships as predictive models? A SELECT INTERNATIONAL COMPANY
How long does it take to cook a chicken? www.sv-europe.com A SELECT INTERNATIONAL COMPANY
How long does it take to cook a chicken? y = mx + c or 7 minutes per pound plus 45 minutes y = a + bx 20 minutes per pound plus 20 minutes A SELECT INTERNATIONAL COMPANY
Lets look at a demo of Linear Regression in IBM SPSS Statistics www.sv-europe.com A SELECT INTERNATIONAL COMPANY
How can we predict category outcomes? www.sv-europe.com A SELECT INTERNATIONAL COMPANY
Logistic Regression Allows us to predict things that linear regression can t Such as Response to a marketing campaign Credit risk Whether a subscriber is likely to renew a service Risk of equipment failure How likely is it that a particular patient will be readmitted to hospital Whether a charity donor will switch to Direct Debit A SELECT INTERNATIONAL COMPANY
Logistic Regression But . These outcomes are not continuous numbers so standard linear regression won t work When the outcome consists of two categories we use Binary Logistic Regression When the outcome has three or more categories we use Multinomial Logistic Regression Logistic gets around the limitations of describing relationships with straight lines by using a special sigmoid curve A SELECT INTERNATIONAL COMPANY
Logistic Regression Probability of Responding Discount % 00 A SELECT INTERNATIONAL COMPANY
Logistic Regression There is a special formula that converts the values of the predictor coefficients on the x axis to the values on predicted probabilities on the y-axis Probability But what are these numbers on the x-axis? x A SELECT INTERNATIONAL COMPANY
IBM SPSS Regression with R & Python integration Using the SPSS Regression module, we can go beyond Linear Regression and unlock many other types of Regression functionality A SELECT INTERNATIONAL COMPANY
Additional Resources How to model non-linear relationships Check what version / modules of SPSS you have installed See exactly what is included in the Regression Module Video Guides a wide range of SPSS how to topics with mini demos Choosing the correct statistical test How to interpret significance tests Eat your greens blog series on statistical testing and procedures A SELECT INTERNATIONAL COMPANY
Working with Smart Vision Europe Ltd. Sourcing Software You can buy your analytical software from us often with discounts Assist with selection, pilot, implementation & support of analytical tools http://www.sv-europe.com/buy-spss-online/ Training and Consulting Services Guided consulting & training to develop in house skills Delivery of classroom training courses / side by side training support Identification & recruitment of analytical skills into your organisation Advice and Support offer no strings attached technical and business advice relating to analytical activities Technical support services A SELECT INTERNATIONAL COMPANY
Contact us: +44 (0)207 786 3568 info@sv-europe.com Twitter: @sveurope Follow us on Linked In Sign up for our Newsletter twitter linkedin Thank you www.sv-europe.com A SELECT INTERNATIONAL COMPANY