Relationship Between Robert Parker and Neal Martin in Primeur Wine Ratings
Explore the impact of Robert Parker's barrel ratings on en primeur prices in the Bordeaux wine market. Learn about the Bordeaux en primeur process, the influence of wine critic ratings on pricing, and the role of copula functions in modeling nonlinear dependence in wine economics.

Download Presentation

Please find below an Image/Link to download the presentation.
The content on the website is provided AS IS for your information and personal use only. It may not be sold, licensed, or shared on other websites without obtaining consent from the author. If you encounter any issues during the download, it is possible that the publisher has removed the file from their server.
You are allowed to download the files provided on this website for personal or commercial use, subject to the condition that they are used lawfully. All files are the property of their respective owners.
The content on the website is provided AS IS for your information and personal use only. It may not be sold, licensed, or shared on other websites without obtaining consent from the author.
E N D
Presentation Transcript
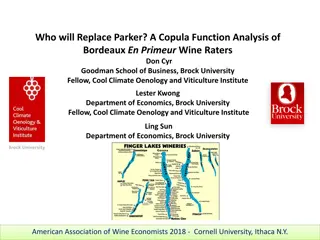
An Exploration of the Relationship Between Robert Parker and Neal Martin en Primeur Wine Ratings Don Cyr Professor of Finance Goodman School of Business, Brock University Fellow, Cool Climate Oenology and Viticulture Institute Brock University Lester Kwong Associate Professor of Economics Brock University Fellow, Cool Climate Oenology and Viticulture Institute Ling Sun Assistant Professor of Economics, Brock University American Association of Wine Economists 2017 - Padua, Italy
Introduction Bordeaux en primeux process Impact of wine critic ratings and wine prices Robert Parker and Neal Martin Copula functions and their use in modelling nonlinear dependence Data Preliminary results on copula function modelling Conclusion American Association of Wine Economists 2017 - Padua, Italy
En Primeur Process The Bordeaux En Primeur Process Existed in France for centuries as a form of futures market Spring of each year, after the prior harvest, merchants, wine critics and trade associations gather to taste and rank barrel samples of wines that are frequently eight to ten months old Wine is then sold ahead of bottling and ultimate release of the vintage, which may be up to two years later Benefit to Purchaser - provides the opportunity for the purchaser to secure a vintage before it is bottled and released, typically at a much lower price Benefit to Producer - cash flow prior to the release and sale of the wine in the retail market Uncertainty - the chateau must decide how much wine to allocate to futures sales as opposed to the retail market, when the wine is bottled and released Risk is mitigated the higher the en primeur price, and prices have been shown to be heavily dependent on the critic barrel scores achieved American Association of Wine Economists 2017 - Padua, Italy
Wine Critic Barrel Ratings Impact of Parker Barrel Ratings En primeur prices appear to be heavily dependent upon the ranking of the wine based on the barrel tastings, despite the uncertainty remaining, associated with the continued aging process It has long been known in the Bordeaux en primeur market that that the barrel scores of the prestigious wine critic Robert Parker Jr. have had a great influence on the en primeur price offering by the chateaux Parker s ratings have been largely viewed as the authority on Bordeaux en primeur wines Noparumpa et al. (2015), Ali et al. (2010), Ashenfelter, (2010), Jones and Storchmann, (2001). American Association of Wine Economists 2017 - Padua, Italy
Wine Critic Barrel Ratings Impact of Wine Critics Ratings on Wine Prices A fairly large body of literature deals with the impact of the ratings of wine critics on the demand for wine and wine prices. Studies of this nature have been carried out for wines originating from several countries and over different time periods Over 60 studies and 180 hedonic wine price models over a 20 year period..... The research identifies that the relation between the price of wine and its sensory quality rating is a moderate partial correlation of +0.30. Oczkowski, E., & Doucouliagos, H. (2015). Wine prices and quality ratings: A meta- regression analysis. American Journal of Agricultural Economics, 97(1), 103-121. American Association of Wine Economists 2017 - Padua, Italy
Wine Critic Barrel Ratings February 2015 After 38 years, Parker announced that he would no longer review Bordeaux wine futures; turning the responsibility over to his successor Neal Martin, a British wine critic. Martin a wine blogger who started the website Wine Journal in 2003 gained a substantial following over a short period of time and joined Parker s prestigous publication, the Wine Advocate as a wine writer and critic in 2006. April 2016 - Martin assumed responsibility for the review of all Bordeaux wines, both in barrel and bottle, for the Wine Advocate American Association of Wine Economists 2017 - Padua, Italy
Wine Critic Barrel Ratings Issue Parker is credited with having had a significant impact on Bordeaux wines Pushed the industry to invest in new technology and equipment resulting in greater consistency over the years Not without some controversy Parker has been criticised for advocating style over substance, resulting in a homogenous world of highly oaked and over- extracted wines. Appointment of Martin creates some uncertainty for many chateaux, both with respect to the future influence of Martin s ratings and their consistency, or lack thereof, with that of Parker s. American Association of Wine Economists 2017 - Padua, Italy
Wine Critic Barrel Ratings en primeur wine database www.borderview.com For the period of 2010 through 2012, Robert Parker and Neal Martin independently rated many of the same Bordeaux en primeur wines, providing the opportunity to examine the bivariate distributional relationship between their evaluations. Provides for 325 left bank concurrent wine ratings and 332 in the case of the right bank, over the three year period. It has been noted that both critics have expressed a preference for Merlot dominated blends stemming from Bordeaux right bank wines Both critics use the same Parker rating system of 50 100. American Association of Wine Economists 2017 - Padua, Italy
Copula Function Approach Model Risk Risk due to assumptions regarding the fundamental dependence structure between variables and its stationarity. Generally a regression analysis is used, assuming the dependence structure is captured fairly well by linear correlation. It appears that this is not often the case. One solution to the issue is the use of copula functions to fit multivariate distributions, incorporating nonlinear dependence Useful for capturing tail dependence higher correlation at the tails of the univariate distributions comprising the multivariate distribution Aside: Interesting connection between copula function modelling and the 2008 Financial Crisis - the incorrect use of the Gaussian copula to model CDO s comprised of multiple mortgages: Salmon, F. (2009). Recipe for Disaster: The Formula That Killed Wall Street, Wired Magazine http://archive.wired.com/techbiz/it/magazine/17-03/wp_quant?currentPage=all American Association of Wine Economists 2017 - Padua, Italy
COPULA Functions Based upon Sklar s Theorem (1959) If F is a joint distribution function of m random variables (y1,...,ym) with marginal distributions F1,......,Fm Then there exists an m-dimensional copula C:[0,1]m [0,1] (from the unit m-cube to the unit interval) which satisfies the following conditions: 1. C (1,...,1,an, 1,...,1) = an for every n m and for all an in [0,1] If the realizations of m-1 variables are known, each with a probability of one, then the joint probability of the m outcomes is the same as the probability of the remaining uncertain outcomes. 2. C(a1,...,am) = 0 if an = 0 for any n m The joint probability of all outcomes is zero if the marginal probability of any outcome is zero. 3. C is m-increasing C-volume of any m-dimensional interval is non-negative. American Association of Wine Economists 2017 - Padua, Italy
COPULA Functions Sklar s Theorem (1959) Given F (y1,...,ym) with univariate marginal distributions F1(y1),...,Fm(ym) and inverse functions F1-1,..., Fm-1, then y1 = F1-1(u1)~F1,..., ym = Fm-1(um)~Fm Where u1,...,um are uniformly distributed variates. F(y1,...,ym) = F(F1-1(u1),..., Fm-1(um)) = Pr[U1 u1,..., Um um] = C(u1,...,um) Is the unique copula function associated with the distribution function and (F1(y1),...,Fm(ym)) ~ C and if U ~ C, then (F1-1(u1),..., Fm-1(um)) ~ F Essentially Copulas can be used to express a mutivariate distribution in terms of its marginal distributions! American Association of Wine Economists 2017 - Padua, Italy
COPULA Functions Sklar s Theorem (1959) For an m-variate function F, the copula associated with F is a distribution function C:[0,1]m [0,1] that satisfies. F (y1,...,ym) = C (F1(y1),...,Fm(ym); ) Where is a vector of parameters called the dependence parameter which measures dependence between the marginals. In bivariate applications is typically a scalar. The joint distribution is expressed in terms of its respective marginal distributions and a function C that binds them together. This allows for the consideration of marginal distributions and dependence as two separate but related issues. American Association of Wine Economists 2017 - Padua, Italy
COPULA Functions Application of Copula Functions For a variety of reasons, largely due to the high dimensionality of m 3 copula estimation, most research has focused on bivariate parametric copulas. Parametric copulas -Implicit (Gaussian and Student t copula) implied by known multivariate distribution functions and do not have simple closed forms. -Explicit (Archimedian Copulas) simple closed forms. Form and relationship of parameters to Spearman correlation American Association of Wine Economists 2017 - Padua, Italy
COPULA Functions Two Parametric Families of Copula Functions are commonly used. 1. ELLIPTICAL COPULAS Can capture some degree of tail dependence but are limited in that they are symmetric. Tend to under estimate tail dependence if it is asymmetric. Gaussian (Normal) Copula Student-T Copula More flexible than the Gaussian copula because It does not assume that uncorrelated variables are independent. American Association of Wine Economists 2017 - Padua, Italy
COPULA Functions ARCHIMEDIAN COPULAS allow for a wider variety of dependence structures, particularly asymmetric Clayton Copula Greater dependence in the lower tail. Gumbel Copula Greater dependence in the upper tail. Frank Copula Greater correlation in the middle section than in the tails. American Association of Wine Economists 2017 - Padua, Italy
COPULA Functions Clayton and Gumbel Copulas can also be estimated as transformations of the variables (u, v) by taking one or both of the variables and transforming them as 1-u and/or 1-v, resulting in three additional patterns that can be tested. This provides for directional patterns of 1, 2, 3 and 4. American Association of Wine Economists 2017 - Padua, Italy
COPULA Functions Tail Dependence Parameters With the Archimedean family asymmetric tail dependence structures between covariates can be measured in a tractable way. In particular upper ( U [0,1]) and lower ( L [0,1]) asymptotic tail dependence measures can frequently be derived from the copula parameters as well as, in limited cases, the relationship to rank correlation measures such as Kendall s tau ( K) and Spearman s rho ( S). American Association of Wine Economists 2017 - Padua, Italy
Data and Analysis Database of en primeur prices along with wine critics ratings are available from Bolomey Wijnimport Amsterdam wine sellers http://www.bordoverview.com Data is also provided for left bank ( Cabernet Sauvignon dominant) and right bank (Merlot dominant) wines Jones and Storchman (2001) - Show less sensitivity of wine prices to Parker ratings in the case of wines with a higher share of Merlot grape than Cabernet Sauvignon. Screenshot of database American Association of Wine Economists 2017 - Padua, Italy
Data and Analysis Standard Approach to Copula Function Modelling: Fit several copula functions to the data and apply maximum likelihood goodness- of-fit tests to see which function models the dependency structure relatively better. Information Criteria Tests (varying penalties for additional parameters) Akaike Information Criteria (AIC) Bayesian (Schwartz) Information Criteria (BIC) Hannan-Quinn Information Criteria (HQIC) Problem is that they do not provide the power of the decision rule. American Association of Wine Economists 2017 - Padua, Italy
Goodness of Fit Tests for Copulas A few goodness of fit tests have recently been developed for copula functions but significant issues still remain: Problematic due to the high dimensionality of the problem. Full multivariate approach - Panchenco (2005) Physica A Consequently there are approaches that attempt to reduce the problem from a multivariate to a univariate problem: Berg and Batten (2005) Norwegian Computing Centre Genest, Quessy and Remillard (2006) Scandinavian Journal of Statistics However the power of the tests appear to differ with sample size, dimensionality and copula function being tested: Berg, D. (2009). Copula goodness-of-fit testing: an overview and power comparison. The European Journal of Finance, 15(7-8), 675-701 Fermanian, J. D. (2013). An overview of the goodness-of-fit test problem for copulas. In Copulae in Mathematical and Quantitative Finance (pp. 61-89). Springer Berlin Heidelberg. American Association of Wine Economists 2017 - Padua, Italy
Data and Analysis : Copula function models were estimated for each of the years 2010-12 and for left and right bank in each case, using Vose ModelRisk software. www.vosesoftware.com Maximum likelihood estimation of copula function parameters used to identify best fit among traditional copula functions Clayton Frank Gumbel Normal T American Association of Wine Economists 2017 - Padua, Italy
RESULTS Best Fitting Copula Functions* Employing Akaike Information Criteria Test Statistic Left Bank Right Bank Copula obs Copula obs K K P U L P U L 2010 2011 2012 Normal Clayton(-) Clayton(-) 113 0.38 0.52 0.57 0.00 Normal 114 0.49 0.69 0.00 0.00 Clayton(-) 107 0.47 0.68 0.68 0.00 98 0.39 0.61 0.58 0.00 Normal 117 0.33 0.68 0.00 0.00 108 0.45 0.67 0.00 0.00 2010-12 Clayton(-) 325 0.47 0.67 0.67 0.00 Gumbel 332 0.43 0.64 0.52 0.00 Combined Left and Right Bank Copula obs K P U L 2010 2011 2012 Gumbel Clayton (-) 215 0.35 0.53 0.53 0.00 Gumbel 221 0.44 0.62 0.53 0.00 221 0.47 0.68 0.55 0.00 2010-12 Gumbel 657 0.45 0.65 0.53 0.00 Clayton(-) indicates inverted transformed data indicates upper tail dependence CCOVI March 2017 Presentation
RESULTS Significant tail dependence in the multivariate distribution of Parker s and Martin s ratings, particularly for left bank wines. 2011, 2012: Martin s ratings of left bank wines appear to be highly correlated with that of Parker s when the ranking is high (upper tail dependence), but less so at the lower range. The right bank exhibits a different correlation pattern. 2010 upper tail dependence 2011 and 2012 - Gaussian (Normal) copula - lack of tail dependence along with slightly less correlation Did Martin start to develop his own idiosyncratic preferences in terms of Bordeaux wines and particularly highly ranked right bank wines? If so, does this add risk for right bank Bordeaux wine producers, in terms of uncertainty with respect to Martin s preferences and in particular their consistency with Parker s preferences? CCOVI March 2017 Presentation
RESULTS Identification of Marginal Distributions Given the identification of a best fitting copula, the next stage is the identification of appropriate marginal distribution for Parker and Martin ratings. AIC criteria used to identify best fitting marginal distributions each year and for left and right bank to check stationarity. Bounded (truncated) continuous distributions employed (min 50, max 100) CCOVI March 2017 Presentation
RESULTS Identification of Marginal Distributions When combining across years: Both Martin and Parker distributions exhibit greater skewness in left bank ratings than for right bank Martin s right bank ratings distribution exhibits fatter tails CCOVI March 2017 Presentation
RESULTS Next Steps Monte Carlo simulations involving marginal distribution and copula function choices. Best fitting combination of marginal and copula functions. CCOVI March 2017 Presentation
Future Research Database also consists of rankings by other wine critics Neal Martin Jancis Robinson Tim Atkin Michel Bettane and Thierry Desseauve James Suckling Jeff Leve Decanter wine magazine critics La Revue du Vin de France Jane Anson Perswin Rene Gabriel American Association of Wine Economists 2017 - Padua, Italy
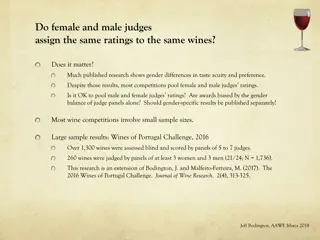
Future Research Ashton, R. H. (2012). Reliability and Consensus of Experienced Wine Judges: Expertise Within and Between? Journal of Wine Economics, 7(01), 70-87.. - Mean reliability between judges is .5 across various studies. Cardebat, J. M., & Livat, F. (2016). Wine experts rating: a matter of taste?. International Journal of Wine Business Research, 28(1), 43-58. Variation might be explained by taste preferences of critics Multivariate copula function could be attempted using addition expert rating or combining ratings: Cardebat, J. M., & Paroissien, E. (2015). Standardizing expert wine scores: An application for Bordeaux en primeur. Journal of Wine Economics, 10(03), 329-348. American Association of Wine Economists 2017 - Padua, Italy
Other Areas of Research with Copula Functions Increased use of Copula functions in Agricultural Economics for the modelling of the relationship between weather variables, prices and crop yields Vedenov (2008) ) - Application of copulas to estimation of joint crop yield distributions Woodward et al. (2011) - Impact of copula choice on the modeling of crop yield basis risk Bokusheva (2011) - Measuring dependence in joint distributions of yield and weather variables Okhrin et al., (2013) - Systemic weather risk and crop insurance: the case of China Boziac et al. (2014) - Tails Curtailed: accounting for nonlinear dependence in pricing margin insurance for dairy farmers Bokusheva et al (2016). Satellite-based vegetation health indices as a criteria for insuring against drought-related yield losses Cyr, D., Eyler, R., & Visser, M. (2013). The Use of Copula Functions in Pricing Weather Contracts for the California Wine Industry. Working paper. Brock University CCOVI March 2017 Presentation
The End American Association of Wine Economists 2017 - Padua, Italy