Renewable Energy in Indiana: Overview and Perspectives
Landscape of renewable energy in Indiana with insights on wind and solar capacity, electricity generation, and pricing. Learn about the growth of photovoltaics, historical trends, and the state's future energy prospects. Discover key statistics on energy consumption, generation capacity, and population demographics.

Download Presentation

Please find below an Image/Link to download the presentation.
The content on the website is provided AS IS for your information and personal use only. It may not be sold, licensed, or shared on other websites without obtaining consent from the author.If you encounter any issues during the download, it is possible that the publisher has removed the file from their server.
You are allowed to download the files provided on this website for personal or commercial use, subject to the condition that they are used lawfully. All files are the property of their respective owners.
The content on the website is provided AS IS for your information and personal use only. It may not be sold, licensed, or shared on other websites without obtaining consent from the author.
E N D
Presentation Transcript
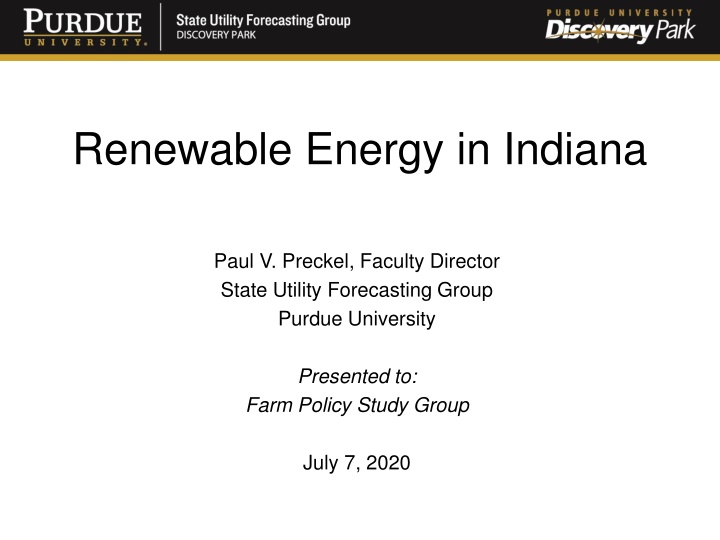
Renewable Energy in Indiana Paul V. Preckel, Faculty Director State Utility Forecasting Group Purdue University Presented to: Farm Policy Study Group July 7, 2020
2018 U.S. Energy Consumption by Source 2 Source: EIA
Historical Renewable Energy in the U.S. 3 Source: EIA
2018 U.S. Electricity Generation by Energy Source 4 Source: EIA
Renewables Share of Indiana Total Energy Consumption 5 Source: EIA
Renewables Share of Indiana Electricity Generation 6 Source: EIA
Indiana Wind Capacity Over 2.7 GW of capacity online by the end of the year IRPs indicate over 5 GW of additional wind in preferred portfolios 7 Sources: IURC, EIA
Photovoltaics There is an estimated 322 MW of PV capacity in Indiana, almost all of it installed in the last six years Continued growth of utility scale PV is indicated utility IRPs include over 7,000 MW of future PV additions in preferred portfolios PV costs have decreased by over 60% since 2010 8
Indiana Perspective Indiana Generation Capacity 25GW (Peak Demand 19GW) Wind 2.7GW existing; 7GW tentatively planned Solar PV 0.3GW existing; 7GW tentatively planned Capacity credit varies by technology (Wind is 8- 14% and Solar is about 50%) Indiana Electricity Pricing (2017): Res. 11.8 /kWh, Com. 9.6 /kWh, Ind. 7.8 /kWh 9
Indiana Perspective (contd.) Indiana 2019 population 6.7 million Average persons per household 2.5 Indiana 2019 households 2.5 million (Source U.S. Census) Average generation capacity per household 10kW (loose upper bound) Average 2017 electricity generation per household 12,600kWh (12.6MWh) 10
Why the Shift to Renewables? Falling capital costs + low operating and maintenance costs Levelized Cost of Energy (LCOE) incorporates both costs Policy Renewable Portfolio Standards 11
Issues as Penetration Grows Not all power sources are equal Dispatch-ability absent economical, utility scale storage, and load must equal generation moment to moment Reliability how much of capacity can be relied upon when needed? (Don t forget capacity credit!) 14
Policy Issues Generation portfolio mix reliability, cost, resilience Many Federal incentives are expiring Some less generous ones remain Indiana net metering expires after June 30, 2022 Other less generous Indiana incentives remain NIPSCO feed-in tariffs available in their service area 15
Further Information State Utility Forecasting Group 765-494-4223 www.purdue.edu/discoverypark/SUFG/ Paul Preckel 765-494-4240 preckel@purdue.edu 16
Wind/Solar Incentives Expiring Federal Expire December 31, 2019: Production Tax Credit Business Energy Tax Credit MACRS (accelerated depreciation) 17
Continuing Incentives Federal USDA REAP (grants and loan guarantees up to 25% of project costs) QECBs (tax credit bonds) USDA High Energy Cost Grant Program (any applicable areas in Indiana?) Residential Renewable Energy Tax Credit (tax credit of 30% of allowable costs) DOE Loan Guarantee Program 18
Continuing Incentives (contd.) Indiana Net Metering Rule (If installed by June 30, 2022, retail credit until July 1, 2047; if installed after June 30 2022 1.25 utility's average wholesale cost) Renewable Energy Property Tax Exemption Sales and Use Tax Exemption for Electrical Generating Equipment (only clear for wind) Clean Energy Portfolio Goal 19
Continuing Incentives (contd.) Utility NIPSCO feed-in tariff (for 15 years with payment determined by based size of project and availability of subsidy in tiers) Impending COVID-19 Stimulus Package could possibly change the story 20
Organic Waste Biomass Until the recent increase in ethanol production, this resource was the largest source of renewable energy in Indiana Now third behind biofuels and wind It is the 2nd largest source of renewable electricity generation in the state Landfill gas (71 MW) Animal waste biogas (20 MW) Wastewater treatment (195 kW) 21
Hydroelectric Power Until expansion of wind energy beginning in 2008, hydroelectricity was the largest source of renewable electricity in Indiana Now third behind wind and biomass The 88 MW project at the Cannelton Locks on the Ohio River was completed in 2016 Most of the output goes to utilities outside Indiana 22


")

")
")


")
")


")