Renewable Portfolio Standards Update 2012 Compliance Modifications & Progress
The Renewable Portfolio Standards (RPS) update for 2012 outlines compliance modifications, progress, and future projections. It covers various states' RPS policies, obligations, and percentages, providing insights into the renewable energy market landscape. The content delves into compliance percentages, obligations for different years, and additional details regarding renewable energy standards.

Download Presentation

Please find below an Image/Link to download the presentation.
The content on the website is provided AS IS for your information and personal use only. It may not be sold, licensed, or shared on other websites without obtaining consent from the author.If you encounter any issues during the download, it is possible that the publisher has removed the file from their server.
You are allowed to download the files provided on this website for personal or commercial use, subject to the condition that they are used lawfully. All files are the property of their respective owners.
The content on the website is provided AS IS for your information and personal use only. It may not be sold, licensed, or shared on other websites without obtaining consent from the author.
E N D
Presentation Transcript
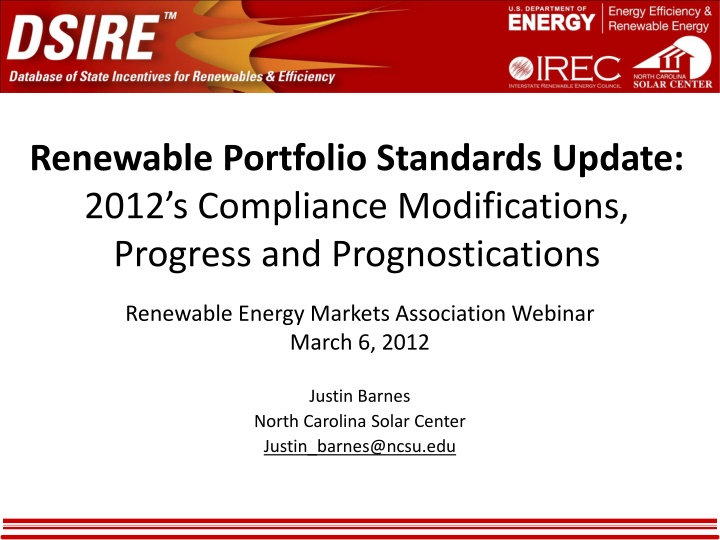
Renewable Portfolio Standards Update: 2012 s Compliance Modifications, Progress and Prognostications Renewable Energy Markets Association Webinar March 6, 2012 Justin Barnes North Carolina Solar Center Justin_barnes@ncsu.edu
RPS Policies www.dsireusa.org / February 2012 ME: 30% x 2000 New RE: 10% x 2017 NH: 23.8% x 2025 MA: 22.1% x 2020 New RE: 15% x 2020 (+1% annually thereafter) RI: 16% x 2020 CT: 27% x 2020 PA: ~18% x 2021 VT: (1) RE meets any increase in retail sales x 2012; (2) 20% RE & CHP x 2017 WA: 15% x 2020* MN: 25% x 2025 (Xcel: 30% x 2020) MT: 15% x 2015 MI: 10% & 1,100 MW x 2015* OR: 25% x 2025(large utilities)* 5% - 10% x 2025 (smaller utilities) ND: 10% x 2015 SD: 10% x 2015 WI: Varies by utility; ~10% x 2015 statewide NY: 29% x 2015 CO: 30% by 2020(IOUs) 10% by 2020 (co-ops & large munis)* NV: 25% x 2025* OH: 25% x 2025 IA: 105 MW IL: 25% x 2025 WV: 25% x 2025* VA: 15% x 2025* NJ: 20.38% RE x 2021 + 5,316 GWh solar x 2026 IN: 15% x 2025 CA: 33% x 2020 KS: 20% x 2020 UT: 20% by 2025* MO: 15% x 2021 MD: 20% x 2022 AZ: 15% x 2025 OK: 15% x 2015 NC: 12.5% x 2021(IOUs) 10% x 2018 (co-ops & munis) DE: 25% x 2026* NM: 20% x 2020(IOUs) 10% x 2020 (co-ops) DC DC: 20% x 2020 PR: 20% x 2035 TX: 5,880 MW x 2015 HI: 40% x 2030 29 states + DC and PR have an RPS (8 states have goals) Renewable portfolio standard Minimum solar or customer-sited requirement Renewable portfolio goal * Extra credit for solar or customer-sited renewables Includes non-renewable alternative resources Solar water heating eligible
State AZ CA CO CT DC DE HI IA IL KS MA MD ME MI MN MO MT NC NH NJ NM NV NY OH OR PA RI TX WA WI 2009 MWh Obligation 824,430 29,537,501 1,646,899 no data 591,576 291,451 0 295,800 2,283,383 0 3,096,274 2,770,353 3,514,043 0 3,860,255 0 346,261 0 608,000 5,733,633 852,285 3,551,815 4,868,849 333,809 0 829,374 316,424 6,799,347 0 2,501,915 2010 MWh Obligation 1,015,858 34,116,201 1,520,066 no data 699,887 410,618 957,857 295,800 2,747,874 0 5,468,563 3,539,778 3,832,365 0 7,093,647 0 692,167 24,867 830,347 6,841,213 858,705 3,493,644 3,061,948 602,196 0 no data no data 9,053,544 0 3,850,101 2009 (% Comp) 90% 89% 100% no data 100% 100% n/a 100% 100% n/a 82% 100% 100% n/a 100% n/a 100% n/a 93% 99% 100% 100% 61% 100% n/a 100% 100% 100% n/a 100% 2010 (% Comp) 93% 86% 99% no data 100% 99% 100% 100% 100% n/a 74% 100% 100% n/a 100% n/a 98% 100% 90% 100% 100% 100% 96% 100% n/a no data no data 100% n/a 100% 2012 % Obligation 3.50% 20.00% 15.00% (IOUs) 16.00% 7.50% 8.50% 10.00% 105 MW 7.00% 10.00% 14.10% 9.00% 35.00% 5.60% 18% (Xcel); 12% 2.00% 1.00% 3.00% (IOUs) 10.65% 9.64% (non-solar) 10.00% 15.00% 4.54% (new) 1.50% 5.00% 10.22% 6.50% 3,384 MW 3.00% 5.55% 2013 % Obligation 4.00% 20.00% 15.00% (IOUs) 17.00% 9.00% 10.00% 10.00% 105 MW 8.00% 10.00% 15.10% 10.70% 36.00% 6.80% 18% (Xcel); 12% 2.00% 1.00% 3.00% (IOUs) 11.70% 10.48% (non-solar) 10.00% 18.00% 5.60% (new) 2.00% 5.00% 10.72% 7.50% 3,384 MW 3.00% 5.55% Sources: MWh and compliance % data from Lawrence Berkeley National Lab; 2012 and 2013 compliance obligations from DSIRE.
Items of Interest in 2012 CA adding publicly-owned utilities increases the load covered substantially (~75% to 98%); additional REC sale opportunities NM Current rulemaking could revise the resource diversity requirements within the RPS, revise cost calculations MA Biomass regulations/adjustments for facility efficiency replication in other states? IL Implementation of DG carve-out; IPA stakeholder proceedings established MO PSC has established working group for rule clarifications OH Analysis of cost-cap compliance for FirstEnergy
Trends and Issues Policy scrutiny/review and analysis (CT, ME, MN, MI) Influence of established cost caps on achievement of standard (OH, NM, CO, AZ) Role of long-term contracts in REC procurement (NJ, CT, RI, IL, OH, PA, NH) Renewable resource definitions (many) Interest in offshore wind (NJ, DE, MA, RI, ME, MD?)
Want Updates? Monthly RPS quasi-newsletter Email: justin_barnes@ncsu.edu