Reno Population and Temperature Trends Over Decades
Delve into the evolution of Reno's population and nighttime summer temperatures over the years with detailed data and insightful analysis provided by Nina Oakley and Tamara Wall. Explore the correlation between population growth and temperature fluctuations from 1937 to 2007, offering a unique perspective on the city's demographic changes and climatic patterns.

Download Presentation

Please find below an Image/Link to download the presentation.
The content on the website is provided AS IS for your information and personal use only. It may not be sold, licensed, or shared on other websites without obtaining consent from the author.If you encounter any issues during the download, it is possible that the publisher has removed the file from their server.
You are allowed to download the files provided on this website for personal or commercial use, subject to the condition that they are used lawfully. All files are the property of their respective owners.
The content on the website is provided AS IS for your information and personal use only. It may not be sold, licensed, or shared on other websites without obtaining consent from the author.
E N D
Presentation Transcript
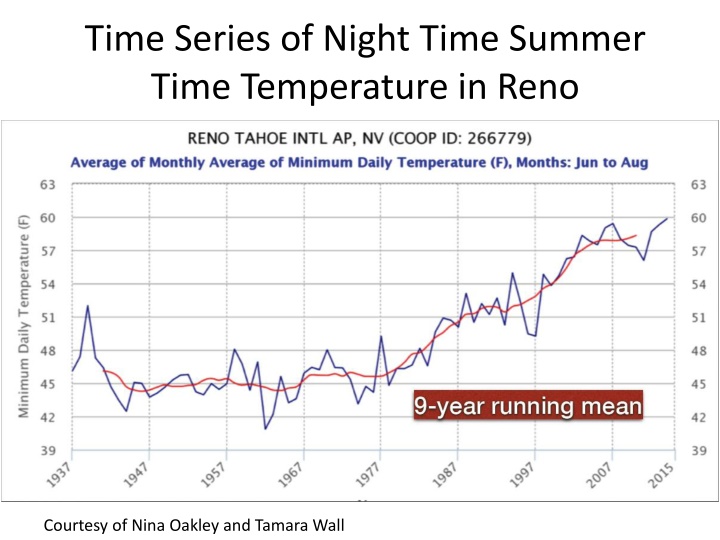
Time Series of Night Time Summer Time Temperature in Reno Courtesy of Nina Oakley and Tamara Wall
Reno Population 250 200 Population (thousands of people) 150 100 50 0 1937 1947 1957 1967 1977 1987 1997 2007 Year
Both Population and Temperature 250 200 Population (thousands of people) 150 100 50 0 1937 1947 1957 1967 1977 1987 1997 2007 Year Courtesy of Nina Oakley and Tamara Wall