Reorganization and Consolidation Feasibility Study in Wisconsin
Explore the complexities of school district reorganization and consolidation in Wisconsin as analyzed by K & K Consulting and Branding. The study emphasizes the limitations of merging decisions on a case-by-case basis, highlighting the diverse nature of educational institutions and the pitfalls of rigid organizational criteria. Various alternatives to consolidation are proposed to enhance educational opportunities and cost-effectiveness without compromising existing units. Dive into the demographic shifts in Benton, Cuba City, and Shullsburg School Districts over a 12-year period to understand the student population dynamics.

Download Presentation

Please find below an Image/Link to download the presentation.
The content on the website is provided AS IS for your information and personal use only. It may not be sold, licensed, or shared on other websites without obtaining consent from the author. If you encounter any issues during the download, it is possible that the publisher has removed the file from their server.
You are allowed to download the files provided on this website for personal or commercial use, subject to the condition that they are used lawfully. All files are the property of their respective owners.
The content on the website is provided AS IS for your information and personal use only. It may not be sold, licensed, or shared on other websites without obtaining consent from the author.
E N D
Presentation Transcript
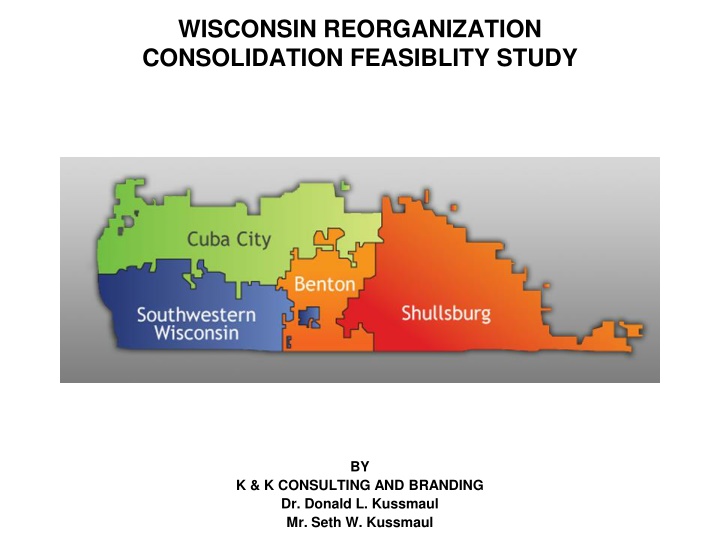
WISCONSIN REORGANIZATION CONSOLIDATION FEASIBLITY STUDY BY K & K CONSULTING AND BRANDING Dr. Donald L. Kussmaul Mr. Seth W. Kussmaul
Reorganization is Complex Merger decisions are too complex and far-reaching in their impact to be made any way other than on a case-by-case basis. Good schools and school districts come in all shapes and sizes (as do poor ones) and therefore, educational policies, which place too much reliance on any rigid size and organizational criteria are likely to be counterproductive. Since directly mandating across-the-board mergers will not advance any compelling state interest, the state should discontinue all backdoor approaches to the same end. There are a variety of alternatives to consolidation that can expand educational opportunities and enhance cost-effectiveness without abolishing existing units. Most important, organizational issues like merger are very rarely the key to enhancing the quality and efficiency of public education. Most important, organizational issues like merger are very rarely the key to enhancing the quality and efficiency of public education. Occasionally, making schools and school districts bigger is helpful, but more often it is merely a diversion away from the greater task of finding new ways to positively influence the lives of children and to increase the effectiveness of those who work in their service.
Part 1 Student Demographics
Benton School District This represents a loss of 71 students or a loss of approximately 23% of the students over a 12 year period. All S tudents - B enton Groups Arranged C hronologically L eft to Right 2007-2008 C ompared to Prior Years 331 318 313 301 302 350 299 291 287 276 259 300 241 250 200 150 100 43 50 0 1996-1997 1997-1998 1998-1999 1999-2000 2000-2001 2001-2002 2002-2003 2003-2004 2004-2005 2005-2006 2006-2007 2007-2008 Count of all students
Cuba City School District This represents a loss of 202 students or approximately 24% of the students over a 12 year period. All S tudents - C uba C ity Groups Arranged C hronologically L eft to Right 2007-2008 C ompared to Prior Years 857 1000 841 827 810 789 771 737 680 688 671 800 650 635 600 400 200 0 1996-1997 1997-1998 1998-1999 1999-2000 2000-2001 2001-2002 2002-2003 2003-2004 2004-2005 2005-2006 2006-2007 2007-2008 Count of all students
Shullsburg School District This represents a loss of 130 students or approximately 24% of the students over a 12 year period. All S tudents - S hullsburg Groups Arranged C hronologically L eft to Right 2007-2008 C ompared to Prior Years 524 600 500 473 461 431 411 500 400 391 394 388 380 377 400 300 200 100 0 1996-1997 1997-1998 1998-1999 1999-2000 2000-2001 2001-2002 2002-2003 2003-2004 2004-2005 2005-2006 2006-2007 2007-2008 Count of all students
Southwestern School District The graph illustrates a steady decline in population over the twelve year span, with slight increases in 2005-06 and 2007-08. The overall loss of students was 129 or 22% of the students. All S tudents - S outhwestern Groups Arranged C hronologically L eft to R ight 2007-2008 C ompared to Prior Years 710 800 670 654 655 617 617 613 604 700 584 581 569 565 600 500 400 300 200 100 0 1996-1997 1997-1998 1998-1999 1999-2000 2000-2001 2001-2002 2002-2003 2003-2004 2004-2005 2005-2006 2006-2007 2007-2008 Count of all students
Conclusions In all four districts, the enrollment of students has decreased between 22 to 24 per cent over a 12 year period and will be based on current class sizes continuing to decrease over the next twelve years. Class sizes will continue to decrease and the cost of education for each individual district will increase if they continue to supply students with the same educational opportunities.
Gender High S chool Enrollment by Gender Groups Arranged Alphabetically Top to Bottom 2007-2008 C ompared Between High S chools Benton 50 50 Cuba City 49.1 50.9 S hullsburg 50.4 49.6 S outhwestern 45.6 54.4 0% 20% 40% 60% 80% 100% % Female % Male
Race/Ethnicity High S chool E nrollment by R ace/ E thnicity Groups Arranged Alphabetically Top to B ottom 2007-2008 C ompared between High S chools Benton Cuba City S hullsburg S outhwestern 0% 20% 40% 60% 80% 100% % American Indian % Asian % Black % Hispanic % White Enrollment (9-12) % American Indian % Asian % Black % Hispanic % White Southwestern 206 0 0.5 1 0 98.5 Shullsburg 137 1.5 1.5 0 3.6 93.4 Cuba City 265 0 0 0 0 100 Benton 110 0 0 0 0.9 99.1
Disability High S chool Enrollment by Disability Groups Arranged Alphabetically Top to Bottom 2007-2008 C ompared Between High S chools Benton 9.1 90.9 Cuba City 10.6 89.4 S hullsburg 16.8 83.2 S outhwestern 14.6 85.4 0% 20% 40% 60% 80% 100% % With Disabilities % Without Disabilities
Economic Status High S chool Enrollment by Economic S tatus Groups Arranged Alphabetically Top to Bottom 2007-2008 C ompared Between High S chools 33.6 66.4 Benton 17 83 Cuba City S hullsburg 24.1 75.9 S outhwestern 21.4 78.6 0% 20% 40% 60% 80% 100% % E ligible for S ubsidized Lunch % Not E ligible/No Data
English Proficiency High School Enrollment by English Proficiency Groups Arranged Alphabetically Top to Bottom 2007-2008 Compared Between High Schools Benton 0 0 0 100 Cuba City 0 0 0 100 Shullsburg 0 0 0 100 Southwestern 0 0 0 100 0% 10% 20% 30% 40% 50% 60% 70% 80% 90% 100% % LEP Spanish % LEP Hmong % LEP Other % LEP Other % English Proficient
Enrollment by Grade High S chool Enrollment by Grade Groups Arranged Alphabetically Top to Bottom 2007-2008 C ompared Between High S chools Benton 21.8 18.2 21.8 16.4 Cuba City 27.2 26 21.5 25.3 S hullsburg 24.1 27 27 21.9 S outhwestern 23.8 21.4 28.6 26.2 0% 20% 40% 60% 80% 100% % Grade 9 % Grade 10 % Grade 11 % Grade 12
Benton AYP Tested Grade(s): 3, 4, 5, 6, 7, 8, 10 District: Benton School District Enrollment: 227 2005-2006 2006-2007 2007-2008 AY Objective PStatus AYP Status AYP Status Test Participation Yes Satisfactory Yes Satisfactory Yes Satisfactory Other Academic Indicator Yes Satisfactory Yes Satisfactory Yes Satisfactory Reading Yes Satisfactory Yes Satisfactory Yes Satisfactory Mathematics Yes Satisfactory Yes Satisfactory Yes Satisfactory Met Adequate Yearly Progress Yes Yes Yes Improvement Status: Satisfactory Satisfactory Satisfactory Title 1
Cuba City AYP Tested Grade(s): 3, 4, 5, 6, 7, 8, 10 District: Cuba City School District Enrollment 601 2005-2006 2006-2007 2007-2008 AY Objective PStatus AYP Status AYP Status Test Participation Yes Satisfactory Yes Satisfactory Yes Satisfactory Other Academic Indicator Yes Satisfactory Yes Satisfactory Yes Satisfactory Reading Yes Satisfactory Yes Satisfactory Yes Satisfactory Mathematics Yes Satisfactory Yes Satisfactory Yes Satisfactory Met Adequate Yearly Progress Yes Yes Yes Improvement Status: Satisfactory Satisfactory Satisfactory Title 1
Shullsburg AYP Tested Grade(s): 3, 4, 5, 6, 7, 8, 10 District: Shullsburg School District Enrollment: 364 2005-2006 2006-2007 2007-2008 AY Objective PStatus AYP Status AYP Status Test Participation Yes Satisfactory Yes Satisfactory Yes Satisfactory Other Academic Indicator Yes Satisfactory Yes Satisfactory Yes Satisfactory Reading Yes Satisfactory Yes Satisfactory Yes Satisfactory Mathematics Yes Satisfactory Yes Satisfactory Yes Satisfactory Met Adequate Yearly Progress Yes Yes Yes Improvement Status: Satisfactory Satisfactory Satisfactory Title 1
Southwestern AYP Tested Grade(s): 3, 4, 5, 6, 7, 8, 10 District: Southwestern School District Enrollment: 546 2005-2006 2006-2007 2007-2008 AY Objective PStatus AYP Status AYP Status Test Participation Yes Satisfactory Yes Satisfactory Yes Satisfactory Other Academic Indicator Yes Satisfactory Yes Satisfactory Yes Satisfactory Reading Yes Satisfactory Yes Satisfactory Yes Satisfactory Mathematics Yes Satisfactory Yes Satisfactory Yes Satisfactory Met Adequate Yearly Progress Yes Yes Yes Improvement Status: Satisfactory Satisfactory Satisfactory Title 1
Conclusions All of the schools within the four school districts are offering the basics for students of the districts. All districts are offering what is required by the State of Wisconsin and any and all Federal programs which apply to the individual districts. All districts are offering programs and courses beyond what is required to meet the needs of the community and the educational needs and future of the students. It is evident that the larger the district the more courses and programs are available to students. However, the four districts have built a spirit of cooperation to make district courses open to each other and provide for each district s children. The districts continue to share personnel when possible. The districts offer juniors and seniors courses from the local technical college and have credit agreements with the technical college. Three of the districts have distance-learning labs and provide a series of closed-circuit regular and AP courses for students. The districts meet or exceed the State of Wisconsin assessment standards and meet Adequate Yearly Progress of the federal No Child Left Behind Act. The success of the schools is a credit to the administrators, teachers and staff that work with the students each and everyday.
Extra Co-Curricular Activity Participation - Benton 90.0% 80.0% 70.0% 60.0% 50.0% 40.0% 30.0% 20.0% 10.0% 0.0% 1996- 1997- 1998- 1999- 2000- 2001- 2002- 2003- 2004- 2005- 2006- 2007- 1996- 1997- 1998- 1999- 2000- 2001- 2002- 2003- 2004- 2005- 2006- 2007- 1996- 1997- 1998- 1999- 2000- 2001- 2002- 2003- 2004- 2005- 2006- 2007- Academic Athletic Music Academic Athletic Music 1996-1997 29.9% 1996-1997 67.9% 1996-1997 58.2% 1997-1998 37.8% 1997-1998 62.8% 1997-1998 51.1% 1998-1999 30.9% 1998-1999 66.7% 1998-1999 40.1% 1999-2000 40.5% 1999-2000 71.5% 1999-2000 39.2% 2000-2001 34.0% 2000-2001 70.5% 2000-2001 0.0% 2001-2002 0.0% 2001-2002 8.9% 2001-2002 0.0% 2002-2003 31.2% 2002-2003 83.8% 2002-2003 3.9% 2003-2004 27.0% 2003-2004 56.1% 2003-2004 14.9% 2004-2005 276.2% 2004-2005 428.6% 2004-2005 223.8% 2005-2006 20.4% 2005-2006 60.5% 2005-2006 32.0% 2006-2007 43.8% 2006-2007 60.6% 2006-2007 25.5% 2007-2008 38.6% 2007-2008 66.9% 2007-2008 34.6%
Extra Co-Curricular Activity Participation - Cuba City 70.0% 60.0% 50.0% 40.0% 30.0% 20.0% 10.0% 0.0% 1996- 1997- 1998- 1999- 2000- 2001- 2002- 2003- 2004- 2005- 2006- 2007- 1996- 1997- 1998- 1999- 2000- 2001- 2002- 2003- 2004- 2005- 2006- 2007- 1996- 1997- 1998- 1999- 2000- 2001- 2002- 2003- 2004- 2005- 2006- 2007- Academic Athletic Music Academic Athletic Music 1996-1997 33.1% 1996-1997 58.6% 1996-1997 29.1% 1997-1998 34.4% 1997-1998 60.9% 1997-1998 26.9% 1998-1999 35.1% 1998-1999 60.1% 1998-1999 27.6% 1999-2000 35.5% 1999-2000 65.4% 1999-2000 18.5% 2000-2001 35.5% 2000-2001 61.0% 2000-2001 16.8% 2001-2002 35.9% 2001-2002 62.2% 2001-2002 8.0% 2002-2003 39.8% 2002-2003 60.6% 2002-2003 25.6% 2003-2004 37.3% 2003-2004 52.5% 2003-2004 18.8% 2004-2005 32.8% 2004-2005 53.0% 2004-2005 21.9% 2005-2006 34.5% 2005-2006 56.9% 2005-2006 25.3% 2006-2007 37.3% 2006-2007 55.3% 2006-2007 22.5% 2007-2008 52.1% 2007-2008 61.3% 2007-2008 23.4%
Extra Co-Curricular Activity Participation - Shullsburg 80.0% 70.0% 60.0% 50.0% 40.0% 30.0% 20.0% 10.0% 0.0% 1996- 1997- 1998- 1999- 2000- 2001- 2002- 2003- 2004- 2005- 2006- 2007- 1996- 1997- 1998- 1999- 2000- 2001- 2002- 2003- 2004- 2005- 2006- 2007- 1996- 1997- 1998- 1999- 2000- 2001- 2002- 2003- 2004- 2005- 2006- 2007- Academic Athletic Music Academic Athletic Music 1996-1997 36.0% 1996-1997 72.0% 1996-1997 39.1% 1997-1998 26.2% 1997-1998 68.8% 1997-1998 59.9% 1998-1999 29.4% 1998-1999 58.5% 1998-1999 57.0% 1999-2000 24.0% 1999-2000 68.5% 1999-2000 57.9% 2000-2001 56.8% 2000-2001 71.6% 2000-2001 60.5% 2001-2002 54.2% 2001-2002 55.9% 2001-2002 54.2% 2002-2003 49.1% 2002-2003 62.0% 2002-2003 55.1% 2003-2004 72.4% 2003-2004 66.8% 2003-2004 63.1% 2004-2005 70.0% 2004-2005 54.1% 2004-2005 36.8% 2005-2006 73.0% 2005-2006 73.0% 2005-2006 53.5% 2006-2007 68.7% 2006-2007 72.4% 2006-2007 46.5% 2007-2008 65.9% 2007-2008 64.4% 2007-2008 42.9%
Extra Co-Curricular Activity Participation - Southwestern 90.0% Add title here 80.0% 70.0% 60.0% 50.0% 40.0% 30.0% 20.0% 10.0% 0.0% 1996- 1997- 1998- 1999- 2000- 2001- 2002- 2003- 2004- 2005- 2006- 2007- 1996- 1997- 1998- 1999- 2000- 2001- 2002- 2003- 2004- 2005- 2006- 2007- 1996- 1997- 1998- 1999- 2000- 2001- 2002- 2003- 2004- 2005- 2006- 2007- Academic Athletic Music Academic Athletic Music 1996-1997 9.6% 1996-1997 57.1% 1996-1997 7.5% 1997-1998 15.2% 1997-1998 62.8% 1997-1998 15.7% 1998-1999 16.1% 1998-1999 62.2% 1998-1999 21.4% 1999-2000 20.6% 1999-2000 61.4% 1999-2000 16.9% 2000-2001 24.3% 2000-2001 62.0% 2000-2001 14.8% 2001-2002 31.7% 2001-2002 60.8% 2001-2002 13.4% 2002-2003 23.3% 2002-2003 60.8% 2002-2003 13.4% 2003-2004 34.2% 2003-2004 59.2% 2003-2004 29.9% 2004-2005 33.3% 2004-2005 59.5% 2004-2005 30.3% 2005-2006 37.9% 2005-2006 67.9% 2005-2006 29.7% 2006-2007 44.5% 2006-2007 76.2% 2006-2007 43.6% 2007-2008 42.4% 2007-2008 59.4% 2007-2008 44.6%
Conclusions Extra-co-curricular activities are very important and a significant part of all four schools involved in the study. The districts have increased and decreased activities based upon student interest, qualified sponsor and cost. Cost has not been a big factor with additional support coming from booster clubs and citizens willing to sponsor and support programs. All districts over the years have had success in all three extra-co-curricular areas. Some districts are almost always perennial champs in specific activities and none have significant decreases in student participation. A spirit of cooperation exists with agreements to share students and provide for students to participate in activities of neighboring schools. The largest student participation area over the past 12 years has been in athletics.
Postgraduate - Benton Postgraduation Plans - Benton 2006-2007 2004-2005 2002-2003 2000-2001 1998-1999 1996-1997 0% 20% 40% 60% 80% 100% % 4-Year College % Military % Voc/Tech College % Job Training % Emp. % Misc.
Postgraduate Cuba City Postgraduation Plans - Cuba City 2006-2007 2004-2005 2002-2003 2000-2001 1998-1999 1996-1997 0% 20% 40% 60% 80% 100% % 4-Year College % Military % Voc/Tech College % Job Training % Emp. % Misc.
Postgraduate Shullsburg Postgraduation Plans - Shullsburg 2006-2007 2004-2005 2002-2003 2000-2001 1998-1999 1996-1997 0% 20% 40% 60% 80% 100% % 4-Year College % Voc/Tech College % Emp. % Military % Job Training % Misc.
Postgraduate - Southwestern Postgraduation Plans - Southwestern 2006-2007 2004-2005 2002-2003 2000-2001 1998-1999 1996-1997 0% 20% 40% 60% 80% 100% % 4-Year College % Military % Voc/Tech College % Job Training % Emp. % Misc.
Part 2 Revenue and Expenditures
Revenue - Benton During this time period of 1998 to 2008 the enrollment has decreased from 315 to 247 students PreK-12. In the past 10 years the district has a reduction of 21.6% of students while the revenue for operating the school district has increased 98%. During this time period the district residents built an elementary addition to the high school which is a substantial part of the increased cost. Revenue Per Member - Benton $16,000.00 $14,000.00 $12,000.00 $10,000.00 $8,000.00 $6,000.00 $4,000.00 $2,000.00 $- 1998- 1999 1999- 2000 2000- 2001 2001- 2002 2002- 2003 2003- 2004 2004- 2005 2005- 2006 2006- 2007 State Federal Local: Property Taxes Other Local
Revenue Cuba City During this time period of 1998 to 2008 the enrollment has decreased from 801 to 644 students PreK-12. In the past 10 years the district has a reduction of 20.6% of their students while revenue for operating the school district has increased 43%. During this time period the district residents have made building improvements which is part of the increased cost. Revenue Per Member - Cuba City $14,000.00 $12,000.00 $10,000.00 $8,000.00 $6,000.00 $4,000.00 $2,000.00 $- 1998- 1999 1999- 2000 2000- 2001 2001- 2002 2002- 2003 2003- 2004 2004- 2005 2005- 2006 2006- 2007 State Federal Local: Property Taxes Other Local
Revenue - Shullsburg During this time period of 1998 to 2008 the enrollment has decreased from 460 to 390 students PreK-12. In the past 10 years the district has lost 15.6% of their students while revenue for operating the school district has increased 35%. During this time period the district residents have made building improvements to renovate the school and add additions. Revenue Per Member - Shullsburg $12,000.00 $10,000.00 $8,000.00 $6,000.00 $4,000.00 $2,000.00 $- 1998- 1999 1999- 2000 2000- 2001 2001- 2002 2002- 2003 2003- 2004 2004- 2005 2005- 2006 2006- 2007 State Federal Local: Property Taxes Other Local
Revenue - Southwestern During this time period of 1998 to 2008 the enrollment has decreased from 661students to 568 students PreK-12. In the past 10 years the district has lost 14% of their students while revenue for operating the school district has increased 47%. During this time period the district residents have made renovations to the schools; however, the district has no outstanding bonds at this time. Revenue Per Member - Southwestern $12,000.00 $10,000.00 $8,000.00 $6,000.00 $4,000.00 $2,000.00 $- 1998- 1999 1999- 2000 2000- 2001 2001- 2002 2002- 2003 2003- 2004 2004- 2005 2005- 2006 2006- 2007 State Federal Local: Property Taxes Other Local
Expenditures - Benton During this time period of 1998-2008 the enrollment has decreased from 315 to 247, a loss of 68 students. Expenditures have increased from $2,521,734 in 1998-1999 to $3,507,281.58 in 2007-2008 which is an increase of $985,547 or approximately a 39% increase. Total Cost Per Member - Benton $14,000.00 $12,000.00 $10,000.00 $8,000.00 $6,000.00 $4,000.00 $2,000.00 $- 1998- 1999 1999- 2000 2000- 2001 2001- 2002 2002- 2003 2003- 2004 2004- 2005 2005- 2006 2006- 2007 Current Education Cost Food and Comm. Serv. Transportation and Facilities
Expenditures Cuba City During this time period of 1998-2008 the enrollment has decreased from 801 to 644, a loss of 157 students. Expenditures have increased from $6,189,801 in 1998-1999 to $7,099,876.18 in 2007-2008 which is an increase of $910,075 or approximately 14.7%. Total Cost Per Member - Cuba City $14,000.00 $12,000.00 $10,000.00 $8,000.00 $6,000.00 $4,000.00 $2,000.00 $- 1998- 1999 1999- 2000 2000- 2001 2001- 2002 2002- 2003 2003- 2004 2004- 2005 2005- 2006 2006- 2007 Current Education Cost Food and Comm. Serv. Transportation and Facilities
Expenditures - Shullsburg During this time period of 1998-2008 the enrollment has decreased from 460 to 390, a loss of 70 students. Expenditures have increased from $4,198,979 in 1998-1999 to $4,526,252 in 2007-2008 which is an increase of $327,273 or approximately 7.7%. Total Cost Per Member - Shullsburg $12,000.00 $10,000.00 $8,000.00 $6,000.00 $4,000.00 $2,000.00 $- 1998- 1999 1999- 2000 2000- 2001 2001- 2002 2002- 2003 2003- 2004 2004- 2005 2005- 2006 2006- 2007 Current Education Cost Food and Comm. Serv. Transportation and Facilities
Expenditure - Southwestern During this time period of 1998-2008 the enrollment has decreased from 661 to 568, a loss of 93 students. Expenditures have increased from $5,052,825 in 1998-1999 to $6,385,606 in 2007-2008 which is an increase of $1,332,781 or approximately 26%. Total Cost Per Member - Southwestern $12,000.00 $10,000.00 $8,000.00 $6,000.00 $4,000.00 $2,000.00 $- 1998- 1999 1999- 2000 2000- 2001 2001- 2002 2002- 2003 2003- 2004 2004- 2005 2005- 2006 2006- 2007 Current Education Cost Food and Comm. Serv. Transportation and Facilities
Benton vs. WI Average The Benton School District expenditure per student is $12,628.00 and the State of Wisconsin average expenditure per student is $11,413.00. The difference is $1,215.00 that the Benton School District was spending above the Wisconsin average of all schools. The $1,215.00 is a large difference from the State of Wisconsin average total cost. Total Cost Per Member - Benton Vs. WI Public Schools $14,000.00 $12,000.00 $10,000.00 $8,000.00 $6,000.00 $4,000.00 $2,000.00 $- Benton 2006-2007 WI Public Schools 2006-2007 Current Education Cost Transportation and Facilities Food and Comm. Serv.
Cuba City vs. WI Average The Cuba City School District expenditure per student was $11,614.00 while the average student expenditure among all schools in the State of Wisconsin was $11,413.00. The difference between Cuba City School District and the State average was $201.00 which is minimal. Total Cost Per Member - Cuba City Vs WI Public Schools $12,000.00 $11,500.00 $11,000.00 $10,500.00 $10,000.00 $9,500.00 $9,000.00 $8,500.00 Cuba City 2006-2007 WI Public Schools 2006-2007 Current Education Cost Food and Comm. Serv. Transportation and Facilities
Shullsburg vs. WI Average The Shullsburg School District expenditure per student was $11,040.00 while the average expenditure among all students in the State of Wisconsin was $11,413.00. The difference is a positive $373.00 below the State of Wisconsin total cost per student average. Total Cost Per Member - Shullsburg Vs WI Public Schools $12,000.00 $10,000.00 $8,000.00 $6,000.00 $4,000.00 $2,000.00 $- Shullsburg 2006-2007 WI Public Schools 2006-2007 Current Education Cost Transportation and Facilities Food and Comm. Serv.
Southwestern vs. WI Average The Southwestern Wisconsin School District expenditures per student were $10,827.00 while the average student expenditure among all school districts in the State of Wisconsin was $11,413.00. The difference is a positive $586.00 below the State of Wisconsin total cost per student average. Total Cost Per Member - Southwestern Vs WI Public Schools $12,000.00 $11,500.00 $11,000.00 $10,500.00 $10,000.00 $9,500.00 $9,000.00 $8,500.00 Southwestern 2006-2007 WI Public Schools 2006-2007 Current Education Cost Food and Comm. Serv. Transportation and Facilities
Conclusions While the revenue for the districts has increased, the availability to utilize the funds has been affected by the State Revenue Limiting Program. The districts have been limited by the amount available over the previous year with increases not keeping pace with the cost of education. With the decrease in student enrollment there is additional funding from the State of Wisconsin to help offset cost but the biggest share is the responsibility of the local residents. The districts have done an excellent job in continuing to hold expenditures down during the past 10 years and continuing to offer students a fine education. As reported, the total cost per student in the Benton School District as compared to the entire State of Wisconsin is very high. Declining enrollment and the cost of building bonds over a relatively constant property value is driving the cost in the Benton School District. Building new additions to existing buildings, renovating existing facilities to accommodate technology and meet the educational and safety needs of students comes at a cost. The communities have been supportive in the education of students.
Review facilities The facilities of the four districts considered within this feasibility study are adequate to house present student populations. If the four districts are to become one district then the facilities of each district would be adequate to house the elementary students and should be utilized. Utilization of the facilities should be reviewed periodically and the best use should be based on the sustainability of the student population. If the four districts are to become one district the largest high school based upon student capacity should be maintained for high school students. The Cuba City High School was built for a population of 750 students, however, over the years the addition of special use classrooms have reduced the student population capacity to 600. If a second high school was needed the next largest would be the Southwestern Wisconsin High School and it can house 350 students. The building of a new state of the art high school facility to house high school students of a new district is not financially feasible at this time.
Review Non Facility Measures Consider a common high school schedule that would maximize educational opportunity for students. Establish transportation to meet student needs, set common tuition costs, establish common curriculum and materials, and establish master grading system that would provide students with access to the courses of all four schools. Maximize the sharing of faculty preK-12
Wisconsin State Statutes 121.07(6)(e)1. Wis. State Stats., Shared Cost For a school district created by a consolidation under s. 117.08 or 117.09 in the school year in which the consolidation takes effect and in each of the subsequent 4 school years, the amount under pars. (b) and (d) shall be multiplied by 1.1 and rounded to the next lowest dollar. 121.105(3) Wis. Stats., Special Adjustment Aids In the school year in which a school district consolidation takes effect under s. 117.08 or 117.09 and in each of the subsequent 4 school years, the consolidated school district s state aid shall be an amount that is not less than the aggregate state aid received by the consolidating school districts in the school year prior to the school year in which the consolidation takes effect.
Spendable Revenue Outside State Revenue Controls In the five years after the effective date of the consolidation, the aid guarantee, under 121.105(3), for the new consolidated district has already been determined. Each year the newly consolidated district would run the equalization aid calculation with the 1.1 multiplier and then without the 1.1 multiplier (ceilings and guarantees). The difference between the equalization aid calculation without the 1.1 multiplier and the highest amount of either the aid guarantee, under 121.105(3), or the equalization aid calculation with the 1.1 multiplier is spendable outside the revenue limit. It is this additional aid that is excluded from the state aid definition under revenue limits. {Wis. Stats. 121.90(2)(a)}
Part 3 Consolidation Combinations The following calculations have been completed for all of the consolidation combinations that exist for the four districts. The first calculation represents the amount of local property value supporting each student (the higher the value per student the more local property value support). The second calculation represents the amount of the state revenue base support for the 2008 year divided by the FTE students, as calculated by the State; the calculation determines the base state revenue for each student in the new district. The more state revenue received the better. The following calculations are purely estimates and are for representation only. The calculations deal with one-four school district consolidation, three-three school district consolidations and six-two school district consolidations.
Four School District Consolidation 2008 Data District Property Value Student Benton 72,767,153 252 Cuba City 278,201,713 638 Shullsburg 123,471,837 375 Southwestern 230,739,855 563 TOTAL $705,180,558 1828 $705,180,558 divided by 1,828 = $385,766.17 Value behind each student. District Revenue Estimate FTE. Students Benton 2,349,844 251 Cuba City 5,903,888 637 Shullsburg 3,464,700 384 Southwestern 5,329,216 567 TOTAL $17,047,648 1839 $17,047,648 divided by 1,839 = $9,270.06 State Base Revenue per Student
Three District Consolidation Combinations 2008 Data Benton-Cuba City-Shullsburg District Property Value Students Benton 72,767,153 252 Cuba City 278,201,713 638 Shullsburg 123,471,837 375 TOTAL $474,440,703 1265 $474,440,703 divided by 1,265 = $375,051.94 Property Value per Student District Revenue Estimate FTE. Students Benton 2,349,844 251 Cuba City 5,903,888 637 Shullsburg 3,464,700 384 TOTAL $11,718,432 1272 $11,718,432 divided by 1,272 students =$9,212.60 State Base Revenue per Student
Three School Districts Consolidation Combination 2008 Data Benton- Cuba City-Southwestern Wisconsin District Property Value Students Benton 72,767,153 252 Cuba City 278,201,713 638 Southwestern 230,739,855 563 TOTAL $581,708,721 1,453 $581,708,721 divided by 1,453 =$400,350.12 Property Value Per Student District Revenue Estimate FTE Students Benton 2,349,844 251 Cuba City 5,903,888 637 Southwestern 5,329,216 567 TOTAL $13,582,948 1,455 $13,582,948 divided by 1,455=$9,335.36 - State Base Revenue per Student