Repayment Rates and Student Demographics in Higher Education
Explore the correlations between 5-year repayment rates, percentage of students receiving Pell grants, and SAT Math scores in higher education institutions. Data analysis reveals significant relationships that impact student loan repayment outcomes.

Download Presentation

Please find below an Image/Link to download the presentation.
The content on the website is provided AS IS for your information and personal use only. It may not be sold, licensed, or shared on other websites without obtaining consent from the author. If you encounter any issues during the download, it is possible that the publisher has removed the file from their server.
You are allowed to download the files provided on this website for personal or commercial use, subject to the condition that they are used lawfully. All files are the property of their respective owners.
The content on the website is provided AS IS for your information and personal use only. It may not be sold, licensed, or shared on other websites without obtaining consent from the author.
E N D
Presentation Transcript
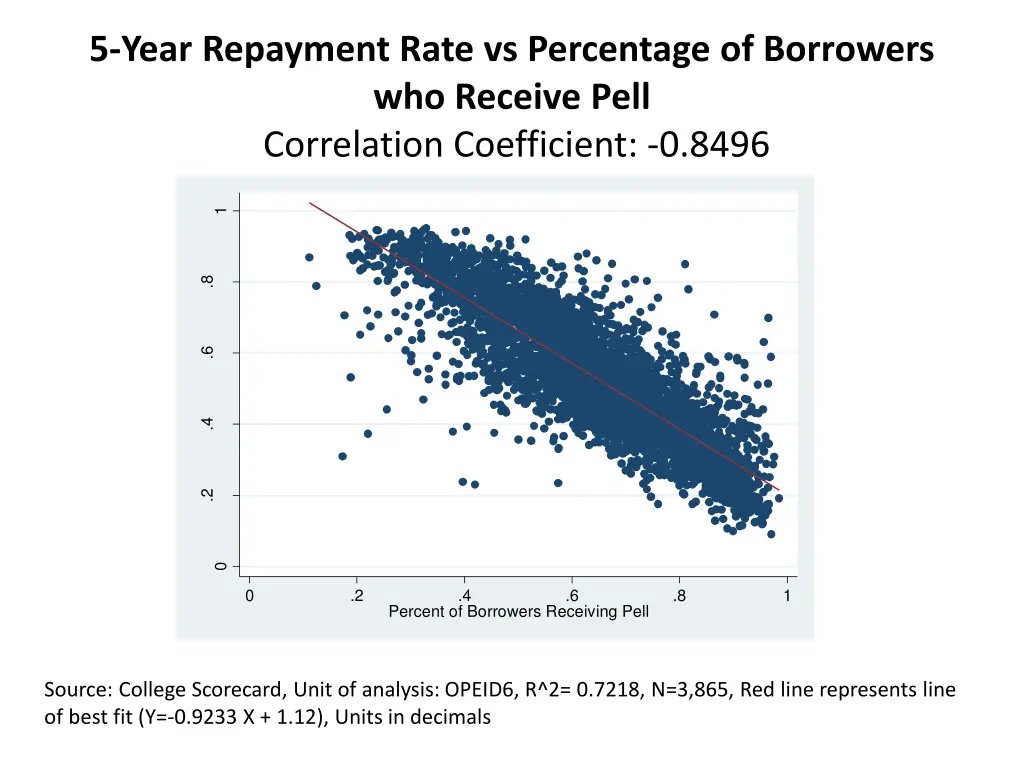
5-Year Repayment Rate vs Percentage of Borrowers who Receive Pell Correlation Coefficient: -0.8496 1 .8 5-Year Repayment Rate .6 .4 .2 0 0 .2 .4 .6 .8 1 Percent of Borrowers Receiving Pell Source: College Scorecard, Unit of analysis: OPEID6, R^2= 0.7218, N=3,865, Red line represents line of best fit (Y=-0.9233 X + 1.12), Units in decimals
5-Year Repayment Rate for Borrowers Receiving Pell vs 5-Year Repayment Rate for Borrowers who do not Receive Pell Correlation Coefficient: 0.8875 Source: College Scorecard, Unit of analysis: OPEID6, R^2= 0.7876, N=3,364, Green line represents line of best fit (Y=1.1X - 0.26 ), Red line represents y=x, Units in decimals
5-Year Repayment Rate vs SAT Math Midpoint Scores Correlation Coefficient: 0.6643 1 .8 5-Year Repayment Rate .6 .4 .2 0 300 400 500 600 700 800 SAT Math Midpoint Scores Source: College Scorecard, Unit of analysis: IPEDS unitid, R^2=0.4412, N= 1,187, Red line represents line of best fit (Y= 0.0013 X - 0.017), x-axis starts at 300, Percent Pell represented in decimals
Percent of Students Receiving Pell vs SAT Math Midpoint Scores Correlation Coefficient: -0.7073 1 Percent of Students Receiving Pell .8 .6 .4 .2 0 300 400 500 600 700 800 SAT Math Midpoint Scores Source: College Scorecard, Unit of analysis: IPEDS unitid, R^2=0.5003, N= 1,201, Red line represents line of best fit (Y= -0.0014 X + 1.108), x-axis starts at 300, Percent Pell represented in decimals


