Reproducibility of Laboratory Results in TB Diagnostic Tools Study
This operational research project in Kenya aims to compare the reproducibility and performance of diagnostic tools for tuberculosis (TB) in different geographical settings. The study focuses on analyzing diagnostic test values, specimen collection, data processing methods, and statistical analysis to enhance quality assurance in TB diagnosis.
Download Presentation

Please find below an Image/Link to download the presentation.
The content on the website is provided AS IS for your information and personal use only. It may not be sold, licensed, or shared on other websites without obtaining consent from the author. If you encounter any issues during the download, it is possible that the publisher has removed the file from their server.
You are allowed to download the files provided on this website for personal or commercial use, subject to the condition that they are used lawfully. All files are the property of their respective owners.
The content on the website is provided AS IS for your information and personal use only. It may not be sold, licensed, or shared on other websites without obtaining consent from the author.
E N D
Presentation Transcript
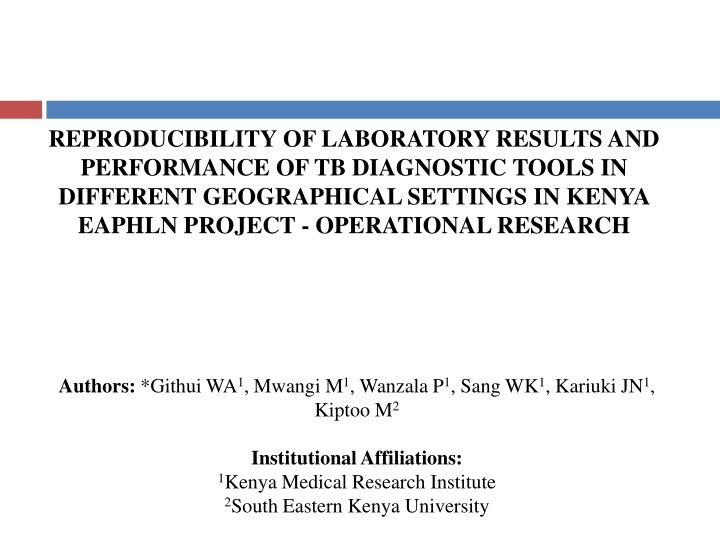
REPRODUCIBILITY OF LABORATORY RESULTS AND PERFORMANCE OF TB DIAGNOSTIC TOOLS IN DIFFERENT GEOGRAPHICAL SETTINGS IN KENYA EAPHLN PROJECT - OPERATIONAL RESEARCH Authors: *Githui WA1, Mwangi M1, Wanzala P1, Sang WK1, Kariuki JN1, Kiptoo M2 Institutional Affiliations: 1Kenya Medical Research Institute 2South Eastern Kenya University
Background Reproducibility of laboratory results and performance of diagnostic tools form a major part of quality assurance in diagnosis, which is key to care of patients with tuberculosis (TB). Reproducibility is the ability of diagnostic test to be duplicated, either by the same researcher or by someone else working independently. Performance of a diagnostic tool results in diagnostic values (sensitivity, specificity, ppv and npv ) generated using a gold standard. In Kenya, performance of new diagnostic tools including LED-FM and GeneXpert, has recently been documented. No study to our knowledge has documented comparison of reproducibility and performance of these tools in different geographical settings.
Objective To compare reproducibility of laboratory results and performance of ZN and new TB diagnostic tools in different geographical settings in Kenya.
Methods (1) Study Design: A cross sectional design involving determination of the diagnostic test values of new TB diagnostics. Study area: Busia, Kitale, Machakos, Malindi, Wajir, Kisii-Keroka, Nyahururu, Olololunga-Narok, Lamu. Study population: People presumed to have TB. Inclusion criteria: Consenting, aged 18 years and above enrolled in public health facilities.
Methods (2) Specimen collection: Two sputum specimens (spot and morning) collected from each patient over two consecutive days. At the study sites, a proportion of each specimen aseptically processed for ZN, LED-FM and GeneXpert. The remainder of the specimen triple packaged and shipped to the TB research laboratory at KEMRI, Nairobi and processed using the three tests and LJ culture in accordance with standard procedures.
Methods (3) Data processing and Statistical methods: Data processing was done using MySQL and IBM SPSS. Reproducibility of laboratory results determined by Kappa values on homogenous specimens. Diagnostic values (sensitivity, specificity, ppv and npv with 95% CI). Results from the same specimens processed at the study sites were compared with those from KEMRI research laboratory. LJ culture was used as a gold standard.
Study profile for the enrolled people with presumptive TB Total number of patients with presumptive TB enrolled N=2967 6 patients without sputum samples Number of patients with sputum samples N=2961 5420 sputum samples - 2659 with both (spot (S) & morning (M)) - 102 with one (14 S, 88 M) 2761 patients with accepted sputum samples sputum Sputum samples from 200 patients rejected Processed at Study sites Laboratories ZN: 2698 patients (97.7%) - 5269 Sputum Processed - 2571 with both (S & M) - 127 with one (100 S, 27 M) FM: 2316 patients (83.8%) - 4494 Sputum Processed - 2178 with both (S & M) - 138 with one (108 S, 30 M) GXpt: 948 patients (34.3%) - 1691 Sputum Processed - 743 with both (S & M) - 205 with one (186 S, 19 M) Processed at KEMRI Research Laboratory GXpt: 1556 patients (56.4%) - 2429 Sputum Processed - 873 with both (S & M) - 683 with one (311 S, 372 M) FM: 2467 patients (89.4%) - 4458 Sputum Processed - 1991 with both (S & M) - 476 with one (221 S, 255 M) Cult: 2358 patients (85.4%) - 4086 Sputum Processed - 1728 with both (S & M) - 630 with one (319 S, 311 M) ZN: 2469 patients (89.4%) - 4453 Sputum Processed - 1984 with both (S & M) - 485 with one (227 S, 258 M)
Table 1: Selected demographic characteristics of the enrolled people presumed to have TB Characteristics Study sites n=2761 565 572 150 971 94 125 62 27 195 1464 1297 206 626 690 453 291 211 136 50 98 % 20.5 20.7 5.4 35.2 3.4 4.5 2.2 1.0 7.1 53.0 47.0 7.5 22.7 25.0 16.4 10.5 7.6 4.9 1.8 3.5 Busia Kitale Machakos Malindi Kisii-Keroka Nyahururu Narok Lamu Wajir Male Female <20 years 20 - 29 years 30 - 39 years 40 - 49 years 50 - 59 years 60 - 69 years 70 - 79 years 80 and above Not documented Gender Age in years
Table 2: Prevalence of tuberculosis among the study participants according to different diagnostic tools (with both spot and morning samples) Point of analysis Diagnostic tool Prevalence (95% CI) 18.5 (17.0-20.0) Study sites laboratories ZN Microscopy (n=2571) FM Microscopy (n=2178) GeneXpert (n=743) ZN Microscopy (n=1984) FM Microscopy (n=1991) GeneXpert (n=873) Culture: LJ (n=1728) 19.5 (17.8-21.2) 25.8 (22.7-28.9) 20.3 (18.5-22.1) KEMRI Research Laboratory 20.6 (18.8-22.4) 25.8 (22.9-28.7) 15.6 (13.9-17.3)
Table 3: Reproducibility of results for different TB diagnostic tools between study sites and KEMRI research laboratory
Table 4: Reproducibility of ZN results between satellite sites and KEMRI research laboratory ZN KEMRI Negative 95% CI Kappa value 0.700 Study site Busia Diagnostic tool ZN sites Positive 93 33 126 109 19 128 41 8 49 123 39 162 29 9 38 Total 122 628 750 160 704 864 50 213 263 164 1180 1344 45 220 265 L U 0.629 0.771 Positive Negative Total Positive Negative Total Positive Negative Total Positive Negative Total Positive Negative Total 29 595 624 51 685 736 9 205 214 41 1141 1182 16 211 227 Kitale ZN sites 0.709 0.646 0.772 Machakos ZN sites 0.788 0.692 0.884 Malindi ZN sites 0.721 0.662 0.780 Wajir ZN sites 0.643 0.516 0.770
Table 5: Reproducibility of ZN results between non-satellite sites and KEMRI research laboratory ZN KEMRI Negative 95% CI L 0.602 0.920 Kappa value 0.761 Study site Kisii- Keroka Diagnostic tool ZN sites Negative Total Positive Negative Total ZN sites Negative Total ZN sites Negative Total Positive 15 5 20 23 5 28 3 4 7 1 2 3 Total 18 143 161 25 107 132 8 93 101 2 25 27 U Positive 3 138 141 2 102 104 5 89 94 1 23 24 Nyahururu ZN 0.835 0.717 0.953 sites Narok 0.352 0.023 0.681 Positive Lamu 0.341 0.000 0.913 Positive
Table 6: Reproducibility of FM results between satellite sites and KEMRI research laboratory FM KEMRI Negative 34 595 629 41 510 551 9 198 207 45 1130 1175 2 9 11 Kappa value 0.767 95% CI Study site Busia Diagnostic tool FM sites Positive 102 15 117 95 13 108 47 9 56 132 31 163 0 2 2 Total 136 610 746 136 523 659 56 207 263 177 1161 1338 2 11 13 L U Positive Negative Total Positive Negative Total Positive Negative Total Positive Negative Total Positive Negative Total 0.704 0.830 Kitale FM sites 0.729 0.660 0.798 Machakos FM sites 0.796 0.706 0.886 Malindi FM sites 0.744 0.689 0.799 Wajir FM sites -0.182 -0.356 -0.008
Table 7: Reproducibility of FM results between non-satellite sites and KEMRI research laboratory FM KEMRI Negative Kappa value 0.679 95% CI Study site Kisii- Keroka Diagnostic tool FM sites Positive 14 5 19 27 6 33 0 0 0 2 1 3 Total 20 139 159 29 144 173 0 1 1 2 22 24 L U Positive Negative Total Positive Negative Total Positive Negative Total Positive Negative Total 6 0.503 0.855 134 140 2 138 140 0 1 1 0 21 21 Nyahururu FM 0.843 0.737 0.949 sites Narok FM sites N/A N/A N/A Lamu FM sites 0.778 0.362 1.000
Table 8: Reproducibility of GeneXpert results between satellite sites and KEMRI research laboratory GeneXpert KEMRI Positive Negative 49 10 59 114 11 125 13 3 16 6 2 8 8 3 11 Kappa value 0.809 95% CI Study site Busia Diagnostic tool GeneXpert sites Total 56 196 252 132 387 519 13 43 56 10 52 62 11 57 68 L U Positive Negative Total Positive Negative Total Positive Negative Total Positive Negative Total Positive Negative Total 7 0.721 0.897 186 193 18 376 394 0 40 40 4 50 54 3 54 57 Kitale GeneXpert sites 0.850 0.797 0.903 Machakos GeneXpert 0.861 0.710 1.000 sites Malindi GeneXpert sites 0.611 0.329 0.893 Wajir GeneXpert sites 0.675 0.434 0.916
Table 9: Performance of different TB diagnostic tools at study sites and KEMRI research laboratory Diagnostic tool ZN sites ZN KEMRI FM sites FM KEMRI GeneXpert sites GeneXpert KEMRI Sen. (95% CI) 500 70.8(66.8-74.8) 3407 93.0(92.1-93.8) 594 59.6 55.7 63.5 3313 95.6 94.9 96.3 3907 500 66.4(62.3-70.5) 3407 93.3(92.4-94.1) 561 59.2 55.1 63.3 3346 95.0 94.3 95.7 3907 431 78.4(74.5-82.3) 2945 92.5(91.6-93.5) 558 60.6 56.5 64.7 2818 96.7 96.0 97.4 3376 431 71.0(66.7-75.3) 2945 93.4(92.5-94.3) 501 61.1 56.8 65.4 2875 95.7 95.0 96.4 3376 133 86.5(80.7-92.3) 824 87.0(84.7-89.3) 222 51.8 45.2 58.4 735 97.6 96.5 98.7 957 133 85.7(79.8-91.7) 824 87.3(85.0-89.5) 219 52.1 45.5 58.7 738 97.4 96.3 98.5 957 n n Spec. (95% CI) N ppv (95% CI) n npv (95% CI) N
Table 10: Performance of ZN microscopy at study sites and KEMRI research laboratory Study sites Busia Busia Kitale Kitale Machakos ZN sites Machakos ZN KEMRI Malindi Malindi Wajir Wajir Keroka Keroka Nyahururu ZN sites Nyahururu ZN KEMRI Narok Narok Lamu Lamu Diagnostic tool ZN sites ZN KEMRI ZN sites ZN KEMRI N 91 91 140 81.4 75.0 140 64.3 56.3 41 65.9 51.3 41 68.3 54.0 147 70.1 62.7 147 68.7 61.2 20 50.0 28.1 20 55.0 33.2 24 45.8 25.9 24 54.2 34.2 23 87.0 73.2 100.0 23 82.6 67.1 11 36.4 11 36.4 3 33.3 3 0.0 Sens. (95%CI) 70.3 60.9 72.5 63.4 Spec. (95%CI) 91.2 89.0 90.9 88.7 93.6 91.9 94.8 93.1 89.6 85.6 90.5 86.7 1197 94.9 93.7 1197 94.9 93.7 245 85.7 81.3 245 89.0 85.1 137 94.9 91.2 137 94.9 91.2 109 95.4 91.5 109 91.7 86.6 90 95.6 91.3 90 96.7 93.0 100.0 24 95.8 87.8 100.0 24 87.5 74.3 100.0 n N 122 52.5 43.6 126 52.4 43.7 160 71.3 64.2 128 70.3 62.4 50 54.0 40.2 49 57.1 43.3 164 62.8 55.4 162 62.3 54.9 45 22.2 10.1 38 28.9 14.5 18 61.1 38.6 20 65.0 44.1 25 80.0 64.3 28 67.9 50.6 8 50.0 15.4 7 57.1 20.5 2 50.0 3 0.0 ppv (95%CI) N 628 624 704 736 213 214 1180 96.3 95.2 1182 96.1 95.0 220 95.5 92.7 227 96.0 93.5 143 90.9 86.2 141 92.2 87.8 107 97.2 94.1 100.0 104 96.2 92.5 93 92.5 87.1 94 92.6 87.2 25 92.0 81.4 100.0 24 87.5 74.3 100.0 npv (95%CI) 95.7 94.1 96.0 94.5 96.3 94.9 93.2 91.4 93.4 90.1 93.9 90.7 N 750 750 864 864 263 263 1344 1344 265 265 161 161 132 132 101 101 27 27 79.7 81.7 87.9 72.2 80.4 82.5 77.5 76.2 71.9 76.8 65.8 74.1 659 659 724 724 222 222 93.4 93.1 95.4 96.4 93.6 94.4 96.1 96.1 90.1 92.9 98.6 98.6 99.3 96.9 99.8 61.3 61.1 78.3 78.2 67.8 71.0 70.2 69.8 34.4 43.4 83.6 85.9 95.7 85.2 84.6 93.8 100.0 0.0 97.3 97.5 97.7 95.0 96.8 97.1 97.4 97.2 98.2 98.6 95.6 96.6 ZN sites ZN KEMRI ZN sites ZN KEMRI ZN sites ZN KEMRI . 98.1 64.8 64.8 86.7 0.0 99.8 97.8 97.9 ZN sites ZN KEMRI ZN sites ZN KEMRI 7.9 7.9 0.0 0.0 0.0 0.0
Table 11: Performance of FM at study sites and KEMRI research laboratory
Table 12: Performance of GeneXpert at satellite sites and KEMRI research laboratory .
Conclusion Results generated by GeneXpert MTB/RIF indicate excellent reproducibility and comparable performance, regardless of geographical setting in Kenya. This suggests that GeneXpert MTB/RIF is a reliable diagnostic tool irrespective of the facility setting. In Kitale study site had consistently higher microscopy sensitivity results than other sites, possibly due to working with partners e.g. AMPATH, Moi University. There is need for continuous training in microscopy to enhance reproducibility of laboratory results and performance of both ZN and FM microscopy especially in sites where the values were low.


