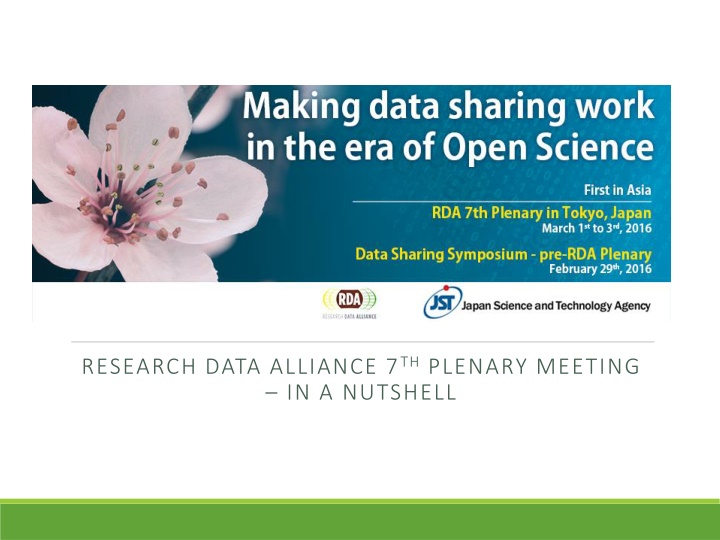
Research Data Alliance 7th Plenary Meeting Highlights
"Discover key insights from the Research Data Alliance's 7th Plenary Meeting, including recommendations, regional breakdown, gender balance, participant breakdown by organization type, and global participation evolution. Explore the diverse topics discussed and the international representation at this dynamic event."

Download Presentation

Please find below an Image/Link to download the presentation.
The content on the website is provided AS IS for your information and personal use only. It may not be sold, licensed, or shared on other websites without obtaining consent from the author. If you encounter any issues during the download, it is possible that the publisher has removed the file from their server.
You are allowed to download the files provided on this website for personal or commercial use, subject to the condition that they are used lawfully. All files are the property of their respective owners.
The content on the website is provided AS IS for your information and personal use only. It may not be sold, licensed, or shared on other websites without obtaining consent from the author.
E N D
Presentation Transcript
RESEARCH DATA ALLIANCE 7THPLENARY MEETING IN A NUTSHELL
7 RDA Recommendations/outputs presented: 30 international speakers over 5 plenary sessions Repository Audit and Certification DSA WDS 7 outputs & 11 adoption cases RDA/WDS Publishing Data Bibliometrics 373 373 attendees attendees from from 33 countries countries 8 Working Group meetings 33 RDA/WDS Publishing Data Services 25 Interest Group meetings RDA/WDS Publishing Data Workflows 10 Birds of a Feather Wheat Data Interoperability Recommendations 9 Joint Working / Interest meetings RDA/CODATA Summer Schools in Data Science and Cloud Computing in the Developing World Interim Recommendations 2 Organisational Member meetings Brokering Governance Interim Recommendations 11 adoption presentations RDA for Newcomers Meeting https://rd https://rd- -alliance.org/plenary alliance.org/plenary- -meetings/rda meetings/rda- -seventh seventh- -plenary plenary- -meeting.html meeting.html
REGIONAL BREAKDOWN Australia 3% (11) Other 13% (50) Europe 34% (128) Japan 30% (113) GENDER BALANCE 11 128 34% 71 19% 113 30% 50 13% 3% Australia Europe United States Japan Other Total Regional Breakdown Female 29% United States 71 (19%) Male 71% 373 Total Attendees: 373 of which 30% Japanese & 32% first timer attendees https://rd https://rd- -alliance.org/plenary alliance.org/plenary- -meetings/rda meetings/rda- -seventh seventh- -plenary plenary- -meeting.html meeting.html
Participants breakdown by type of organisation 250 Total No. RDA P7 Participants 200 150 100 50 0 IT Type of Organisation TOTAL % Governme nt/Public Services Small and Medium Enterprise Policy/Fun ding Agency Academia/ Research Consultanc y/Develop ment Large Enterprise Press & Media Academia/Research 212 57% Other Government/Public Services 88 24% IT Consultancy/Development 7 2% TOTAL 212 88 7 16 14 2 15 19 Large Enterprise 16 4% Other 14 4% Press & Media 2 1% Small and Medium Enterprise 15 4% Policy/Funding Agency 19 5% https://rd https://rd- -alliance.org/plenary alliance.org/plenary- -meetings/rda meetings/rda- -seventh seventh- -plenary plenary- -meeting.html meeting.html
RDA plenary Regional Participation Evolution 450 400 350 300 250 200 150 100 50 0 Goteborg, SE Washington Dublin, IE Amsterdam, NL San Diego, US Paris, FR Tokyo, JP DC, US Growth in Japanese participation across RDA Plenary meetings AU EU US Other 120 100 125 Japanese Members -- 7th most represented country in RDA Individual Membership 80 60 40 20 0
Regional Participation Evolution across Plenary Meetings Final participant breakdown by region P7 March 2016 Tokyo, JP P1 March 2013 Goteborg, SE P3 March 2014 Dublin, IEAmsterdam, P4 Sept 2014 P5 March 2015 San Diego, US P6 Sept 2015 P2 Sept 2013 Washington DC, US % Regional REGION Paris, FR Overall NL AU EU US Other Total Other of which Japan 6 5 16 365 78 38 497 12 399 101 43 555 12 118 200 53 383 20 405 115 65 605 11 128 71 163 373 3% 57% 28% 13% 100% 186 49 105 236 18 364 0 241 0 4 12 8 16 28 113 6%
04/04/2025 rd-alliance.org 7