Research Findings on Beta-Endorphin and Progesterone Interaction
Explore the interaction between beta-endorphin and progesterone in regulating acrosome reaction in sperm cells, as depicted in detailed figures and experimental data. Discover the effects of different concentrations and inhibitors on sperm function, providing insights into reproductive biology mechanisms.

Download Presentation

Please find below an Image/Link to download the presentation.
The content on the website is provided AS IS for your information and personal use only. It may not be sold, licensed, or shared on other websites without obtaining consent from the author. If you encounter any issues during the download, it is possible that the publisher has removed the file from their server.
You are allowed to download the files provided on this website for personal or commercial use, subject to the condition that they are used lawfully. All files are the property of their respective owners.
The content on the website is provided AS IS for your information and personal use only. It may not be sold, licensed, or shared on other websites without obtaining consent from the author.
E N D
Presentation Transcript
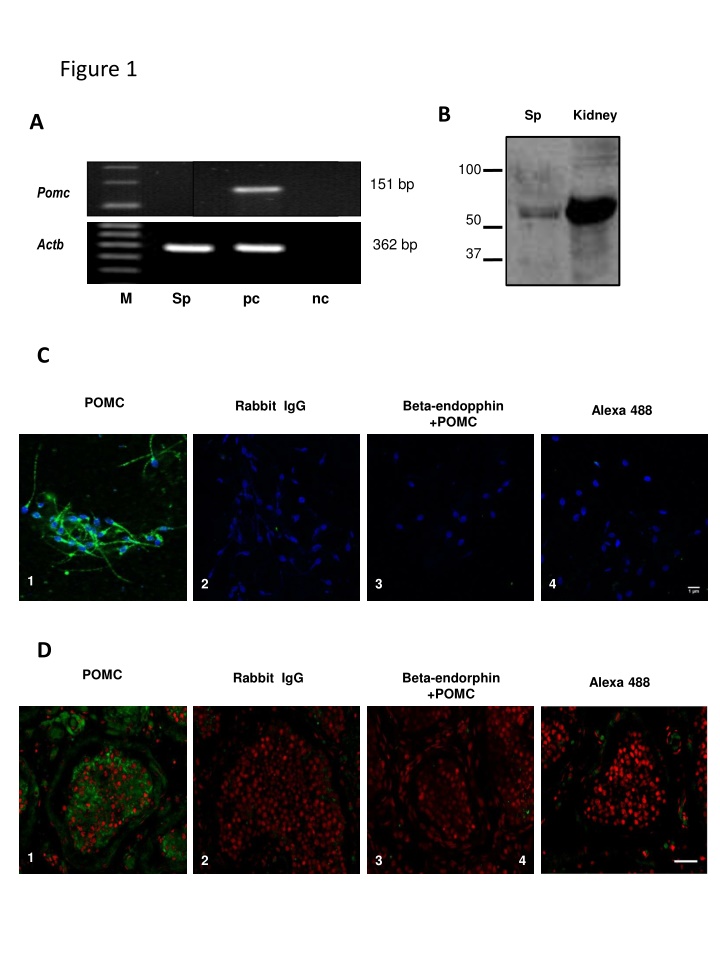
Figure 1 B Sp Kidney A 100 151 bp Pomc 50 362 bp Actb 37 M Sp pc nc C POMC Rabbit IgG Beta-endopphin +POMC Alexa 488 1 2 3 4 D POMC Rabbit IgG Beta-endorphin +POMC Alexa 488 1 2 3 4
Figure 2 A Percentage of acrosome reacted spermatozoa (Normailzed data) 0.6 Beta endorphin 10-5M Beta-endorphin 10-7M Beta-endorphin 10-9M ** 0.4 * 0.2 0.0 Capacitated B Percentage of acrosome reacted spermatozoa (Normailzed data) 0.5 Beta endorphin 10-9M Beta-endorphin10-9M+Naloxone 10-8M Naloxone 10-8M Beta-endorphin10-9M+Naloxone 10-5M Naloxone 10-5M 0.4 ** 0.3 * + 0.2 0.1 0.0 -0.1 -0.2 C Percentage of acrosome reacted spermatozoa (Normailzed data) 1.5 ** Beta endorphin10-9M Beta-endorphin10-9M +Progesterone10-6M Progesterone10-6M + 1.0 ** 0.5 0.0
Figure 3 Control A Beta-endorphin 10-9M EGTA Progesterone 1 M 10 8 Fura-2 ratio TX (F340/380) 6 Beta-endorphin 10-9M 4 2 0 0 200 400 600 800 1000 1200 1400 Time (s) B
Figure 4 A Beta-endorphin + Progesterone Progesterone Negative control Control Beta-endorphin B C 140000 * ** + 3 120000 * 2.5 100000 Fluorescence Intensity * * 80000 2 CTCF 60000 1.5 40000 1 20000 0.5 0 0