Research Revenue Trends and Analysis FY17 Update
Explore the FY17 research revenue trends, sponsor mix, and institution breakdown with a detailed analysis of PHS research revenues and sponsor distribution. Discover the significant increase in total research revenues, driven by Federal Subcontracts, Foundations, and Internally sponsored research.
Uploaded on | 1 Views
Download Presentation

Please find below an Image/Link to download the presentation.
The content on the website is provided AS IS for your information and personal use only. It may not be sold, licensed, or shared on other websites without obtaining consent from the author. If you encounter any issues during the download, it is possible that the publisher has removed the file from their server.
You are allowed to download the files provided on this website for personal or commercial use, subject to the condition that they are used lawfully. All files are the property of their respective owners.
The content on the website is provided AS IS for your information and personal use only. It may not be sold, licensed, or shared on other websites without obtaining consent from the author.
E N D
Presentation Transcript
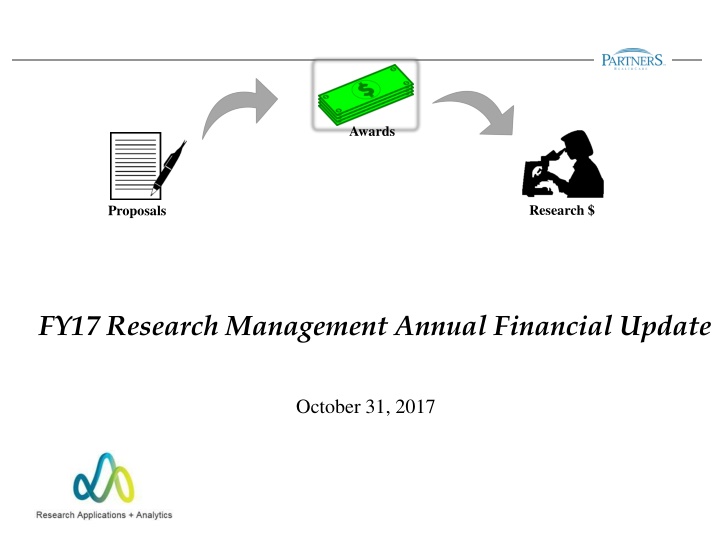
Awards Research $ Proposals FY17 Research Management Annual Financial Update October 31, 2017
PHS Research Revenue Trends Total PHS research revenues exceeded $1.6B, an increase of 6%, driven primarily by increased Federal Subcontract, Foundation, and Internally sponsored research. PHS Research Revenues $1,800 $1,600 $250 $236 $1,400 $210 $156 $176 $143 $118 $194 $84 $109 $93 $101 $85 $1,200 $128 $110 $91 $87 $93 $107 $94 $93 $93 $137 $163 $95 $194 $1,000 $170 $76 $157 $154 $169 $ Millions $122 $92 $153 $99 $133 $166 $54 $77 $114 $117 $137 $122 $143 $65 $39 $800 $123 $34 $45 $130 $36 $103 $40 $41 $49 $46 $98 $41 $98 $95 $28 $39 $101 $84 $85 $80 $26 $600 $28 $30 $400 $765 $733 $732 $729 $714 $680 $671 $612 $595 $574 $562 $200 $0 2007 2008 2009 2010 2011 2012 2013 2014 2015 2016 2017 DHHS ARRA Other Federal Federal Subcontracts Industry/Corporate Non-Profit Foundations All Other Sponsors Source: PHS Research Revenues FY07- FY17 Actual. PHS includes BWH, MGH, McL, SRH, and all other PHS entities. Note: Research Activity, excludes Other Science and P&L adjustments . 2
PHS Research Revenue Sponsor Mix Overall Federal Sponsor mix remained unchanged at 60%, with a 1% point decrease in DHHS offset by a similar increase in Federal Subcontracts. PHS Research Revenue Sponsor Mix 100% 10% 10% 10% 11% 12% 12% 12% 14% 14% 15% 15% 90% 7% 7% 6% 7% 6% 8% 8% 6% 7% 4% 7% 7% 80% 6% 7% 6% 4% 7% 5% 7% 6% 10% 7% 7% 10% 11% 12% 13% 70% 11% 12% 11% 11% 10% 10% 8% 8% 8% 8% 60% 9% 3% 8% 9% 3% 9% 9% 9% 10% 7% 3% 3% 7% 50% 3% 3% 40% 30% 58% 56% 52% 51% 50% 50% 49% 49% 48% 47% 47% 20% 10% 0% 2007 2008 2009 2010 2011 2012 2013 2014 2015 2016 2017 DHHS ARRA Other Federal Federal Subcontracts Industry/Corporate Non-Profit Foundations All Other Sponsors Source: PHS Research Revenues FY07- FY17 Actual. PHS includes BWH, MGH, McL, SRH, and all other PHS entities. Note: Research Activity, excludes Other Science and P&L adjustments . 3
FY17 Research Revenues by Institution and Sponsor Type With Federal Subcontracts Total Research Revenues $1,800 $1,600 $1,400 $1,200 162.5 $1,000 154.8 $ Millions $165.6 $800 $142.3 $600 67.4 93.0 59.7 93.4 $87.9 $400 $72.3 $78.8 $763.4 $59.7 $730.5 $200 $370.5 $363.5 $352.6 $350.3 0.1 FY16 0.4 FY17 $0 FY17 FY16 FY17 FY16 FY17 FY16 FY17 FY16 BWH MGH McL SRH Overall PHS DHHS Federal Subcontracts Other Federal Industry/Corporate Non-Profit Foundations All Other Sponsors Total Research activity is up $94M versus FY16, and up across all institutions and all sponsor categories. *Includes Federal subcontracts sourced from Non-Profits and Foundations Note: Sponsor expenditures as a percent of Total Research Revenue, excluding All Other Science, Accruals, and P&L Adjustments 4
FY17 Immediate Sponsor Mix by Institution Includes Federal Subcontracts Total Revenue TOTAL REVENUE SPONSOR MIX 100% 1% 4% 9% 9% 15% 15% 9% 90% 20% 20% 18% 22% 5% 23% 5% 5% 4% 8% 7% 7% 80% 7% 9% 5% 4% 9% 6% 14% 7% 7% 15% 6% 70% 8% 9% All Other Sponsors 2% 8% 4% 10% 2% 10% 19% 3% 20% 60% 11% 1% 9% 7% Foundations 3% 3% 8% 7% 5% 4% 3% 9% 10% Non-Profit 50% 9% 10% Industry 26% 23% 40% Other Federal 30% Federal Subcontracts* 55% 55% 55% 55% 48% 47% 43% 41% DHHS 20% 29% 28% 10% 0% FY17 FY16 FY17 FY16 FY17 FY16 FY17 FY16 FY17 FY16 BWH MGH McL SRH Overall PHS Including federal subcontracts through non-profits and foundations, all federally sponsored activity accounts for 68% of BWH revenue and 54% of MGH revenue. For all of PHS, 60% of originating sponsored research is sourced through the Federal Government, which is equivalent to FY16. While the overall dollar amount of Federal funding increased by $56M (+6.1%) for Q4 YTD FY17 versus FY16, the overall percentage of Federal funding remained unchanged due to the growth in Industry, Non-Profit (non-federal subcontracts), Foundation, and Internally sponsored research. *Includes Federal subcontracts sourced from Non-Profits and Foundations Note: Sponsor expenditures as a percent of Total Research Revenue, excluding All Other Science, Accruals, and P&L Adjustments 5
NIH Funding Market Share Trends NIH Share of Total Awards Funding by Fiscal Year * 2014 2015 2016 2017 (as of 10/2/17) # of Awards BRIGHAM AND WOMEN'S HOSPITAL MASSACHUSETTS GENERAL HOSPITAL MC LEAN HOSPITAL (BELMONT, MA) SPAULDING REHABILITATION HOSPITAL INSTITUTE OF HEALTH PROFESSIONALS Total PHS # Awards % Total # Awards % Total # Awards % Total # Awards % Total 564 778 84 1.1% 1.5% 0.2% 0.0% 0.0% 2.8% 539 769 83 1.0% 1.5% 0.2% 0.0% 0.0% 2.7% 570 796 74 1.1% 1.5% 0.1% 0.0% 0.0% 2.8% 570 808 67 1.1% 1.5% 0.1% 0.0% 0.0% 2.7% 5 5 5 4 5 2 3 5 1,436 1,400 1,447 1,453 100.0% 100.0% 100.0% 100.0% Total NIH 51,512 51,382 51,666 53,229 2014 2015 2016 2017 (as of 10/2/17) in Thousands $ BRIGHAM AND WOMEN'S HOSPITAL MASSACHUSETTS GENERAL HOSPITAL MC LEAN HOSPITAL (BELMONT, MA) SPAULDING REHABILITATION HOSPITAL INSTITUTE OF HEALTH PROFESSIONALS Total PHS Amount $ $ $ $ $ $ % Total Amount 333,215 $ 350,849 $ 26,165 $ $ $ 712,753 $ % Total Amount 349,522 $ 364,981 $ $ $ $ 744,420 $ % Total Amount 390,389 $ 393,981 $ $ $ $ 807,688 $ % Total 322,835 350,269 28,397 1,514 1,492 704,506 1.4% 1.5% 0.1% 0.0% 0.0% 3.0% 1.4% 1.5% 0.1% 0.0% 0.0% 3.1% 1.4% 1.5% 0.1% 0.0% 0.0% 3.0% 1.6% 1.6% 0.1% 0.0% 0.0% 3.2% ** 27,927 1,377 613 21,626 736 956 1,337 1,187 100.0% 100.0% 100.0% 100.0% Total NIH 23,220,975 $ 23,064,634 $ 24,832,729 $ 24,998,788 $ * Includes Authorized Funding for both new awards and renewals over 12 month period within NIH Fiscal period. NIH fiscal periods will not match PHS emergence of revenues due to timing. **Note PHS market share typically runs higher earlier in the year and declines when final R&D distributions are reported. Fiscal Year notes: FY16 data final as of December 27, 2016. FY17 Data as of October 2, 2017 - Final amounts planned for release on 12/31/17. FY17 NIH Funding through October 2nd is not final, though PHS increases are likely to be small. FY17 data expected to be final on 12/31/2017. PHS Share of FY17 NIH Funding continues to remain top-ranked for Independent Hospitals and is $67M higher {+9.1%} versus this same time-frame from FY16. New PHS FY17 NIH awards stand at $714M, and when coupled with more than $800M in new FY16 awards, we expect strong revenue growth in FY18 and beyond. Source: NIH Funding Report, US. Department of Health and Human Services PHS, Research Finance Analytics 6
NIH Funding Rank Trends All Organizations FY 2013 - FY 2017 NIH RANKING OF INSTITUTION & ACTIVITY BASED ON NIH TOTAL FUNDING TO ALL ACTIVITIES Rank Total Funding Percent Change CAGR FY13 FY14 FY15 FY16 FY17 INSTITUTION FY 2013 FY 2014 FY2015 FY2016 FY2017 13-14 14-15 15-16 16-17 13-17 1 1 1 1 1 $552,624,436 $573,859,735 $567,666,828 $634,940,987 $643,212,567 3.8% -1.1% 11.9% 1.3% 3.9% 2 2 2 2 2 $487,012,070 $537,257,705 $557,140,709 $575,219,351 $588,556,393 10.3% 3.7% 3.2% 2.3% 4.8% 5 6 3 3 3 $396,727,311 $412,933,811 $449,440,199 $483,326,335 $509,085,057 4.1% 8.8% 7.5% 5.3% 6.4% 3 3 4 4 4 $434,609,877 $478,169,721 $448,051,440 $473,635,717 $487,841,724 10.0% -6.3% 5.7% 3.0% 2.9% 6 5 5 5 5 $394,579,413 $419,236,398 $425,603,684 $472,566,210 $483,207,074 6.2% 1.5% 11.0% 2.3% 5.2% 9 8 7 6 6 $338,757,645 $384,029,203 $421,175,041 $425,062,412 $464,374,837 13.4% 9.7% 0.9% 9.2% 8.2% 14 10 9 12 7 $318,396,985 $372,123,938 $377,643,762 $396,519,867 $434,214,053 16.9% 1.5% 5.0% 9.5% 8.1% 4 4 6 9 8 $422,731,094 $423,671,871 $422,917,954 $402,088,254 $426,120,797 0.2% -0.2% -4.9% 6.0% 0.2% 10 11 12 8 9 $333,160,740 $360,022,831 $352,274,351 $406,376,306 $424,901,482 8.1% -2.2% 15.4% 4.6% 6.3% 8 9 8 10 10 $358,014,070 $382,148,517 $387,576,202 $400,413,190 $422,480,577 6.7% 1.4% 3.3% 5.5% 4.2% 12 14 14 11 11 $326,166,532 $342,155,642 $333,942,671 $397,768,992 $420,083,305 4.9% -2.4% 19.1% 5.6% 6.5% 7 7 10 7 12 $367,252,487 $392,740,918 $375,543,736 $408,423,743 $410,444,710 6.9% -4.4% 8.8% 0.5% 2.8% 16 16 16 14 13 $300,254,124 $306,159,165 $330,752,289 $379,738,538 $401,937,326 2.0% 8.0% 14.8% 5.8% 7.6% 11 12 11 13 14 $330,544,193 $357,983,245 $370,466,843 $380,488,703 $400,997,608 8.3% 3.5% 2.7% 5.4% 4.9% 13 13 13 15 15 $339,490,000 $350,268,662 $352,918,609 $364,981,379 $393,980,751 3.2% 0.8% 3.4% 7.9% 3.8% 15 15 15 16 16 $315,920,000 $322,834,979 $333,619,020 $349,521,979 $390,388,808 2.2% 3.3% 4.8% 11.7% 5.4% 19 18 18 17 17 $250,085,940 $265,282,296 $287,920,427 $294,496,913 $306,102,660 6.1% 8.5% 2.3% 3.9% 5.2% 22 22 20 19 18 $192,159,300 $234,768,741 $257,359,170 $275,560,503 $305,438,959 22.2% 9.6% 7.1% 10.8% 12.3% 20 19 19 18 19 $236,078,135 $254,296,731 $268,460,009 $281,550,402 $294,789,616 7.7% 5.6% 4.9% 4.7% 5.7% 30 23 22 23 20 $175,406,940 $221,682,526 $227,271,793 $228,117,239 $268,887,521 26.4% 2.5% 0.4% 17.9% 11.3% 1 1 1 1 1 PARTNERS HEALTHCARE $682,699,000 $704,506,243 $713,232,959 $744,420,217 $807,687,927 3.2% 1.2% 4.4% 8.5% 4.3% Source: NIH Funding Report as of Oct 12, 2017, US. Department of Health and Human Services PHS, Research Finance Analytics 7
NIH Funding Rank Trends Independent Hospitals FY 2013 - FY 2017 NIH RANKING OF INSTITUTION & ACTIVITY BASED ON NIH TOTAL FUNDING TO ALL ACTIVITIES Rank Total Funding Percent Change CAGR FY13 FY14 FY15 FY16 FY17 INSTITUTION FY 2013 FY 2014 FY 2015 FY 2016 FY 2017 13-14 14-15 15-16 16-17 13-17 1 1 1 1 1 $339,490,000 $350,268,662 $352,918,609 $364,981,379 $393,980,751 3.2% 0.8% 3.4% 7.9% 3.8% 2 2 2 2 2 $315,920,000 $322,834,979 $333,619,020 $349,521,979 $390,388,808 2.2% 3.3% 4.8% 11.7% 5.4% #N/A #N/A #N/A 3 3 #N/A #N/A #N/A $241,301,060 $257,037,902 #N/A #N/A #N/A 6.5% #N/A 3 3 3 4 4 $124,160,864 $122,897,976 $135,489,308 $145,731,397 $155,691,457 -1.0% 10.2% 7.6% 6.8% 5.8% 5 4 4 6 5 $115,379,421 $122,652,215 $125,295,828 $128,050,993 $144,578,683 6.3% 2.2% 2.2% 12.9% 5.8% 4 6 5 5 6 $116,122,449 $108,156,442 $109,950,180 $130,439,913 $129,619,057 -6.9% 1.7% 18.6% -0.6% 2.8% 6 5 6 8 7 $105,248,052 $112,146,779 $107,975,876 $108,125,259 $119,124,819 6.6% -3.7% 0.1% 10.2% 3.1% 7 7 7 7 8 $96,824,494 $98,187,760 $96,088,403 $108,784,288 $111,477,556 1.4% -2.1% 13.2% 2.5% 3.6% 8 8 8 9 9 $49,039,532 $48,650,426 $52,088,764 $54,675,595 $56,804,964 -0.8% 7.1% 5.0% 3.9% 3.7% 15 12 9 11 10 $27,956,249 $34,423,826 $41,464,366 $47,417,909 $55,740,921 23.1% 20.5% 14.4% 17.6% 18.8% 9 9 10 12 11 $43,606,668 $46,903,956 $40,234,946 $42,984,276 $48,913,106 7.6% -14.2% 6.8% 13.8% 2.9% 12 10 11 10 12 $30,652,212 $39,068,563 $38,150,472 $50,051,774 $43,676,764 27.5% -2.3% 31.2% -12.7% 9.3% 16 16 12 13 13 $25,551,400 $25,154,637 $35,256,665 $32,453,676 $32,425,913 -1.6% 40.2% -8.0% -0.1% 6.1% 13 17 15 14 14 $30,461,209 $24,335,750 $24,289,073 $29,152,940 $29,480,887 -20.1% -0.2% 20.0% 1.1% -0.8% 10 11 13 16 15 $34,306,306 $38,130,340 $30,277,116 $27,143,128 $28,249,216 11.1% -20.6% -10.4% 4.1% -4.7% 18 19 19 19 16 $20,413,920 $22,398,211 $20,663,625 $19,813,390 $24,747,234 9.7% -7.7% -4.1% 24.9% 4.9% 11 15 14 15 17 $34,034,861 $25,220,309 $28,371,593 $27,887,985 $22,820,055 -25.9% 12.5% -1.7% -18.2% -9.5% 19 21 20 21 18 $20,213,029 $15,007,021 $14,656,374 $16,216,485 $22,709,684 -25.8% -2.3% 10.6% 40.0% 3.0% 20 18 18 18 19 $17,149,123 $22,880,063 $22,263,973 $20,236,544 $21,868,818 33.4% -2.7% -9.1% 8.1% 6.3% 17 14 16 17 20 $24,628,000 $28,396,545 $24,171,160 $27,927,109 $21,626,372 15.3% -14.9% 15.5% -22.6% -3.2% 41 43 46 43 53 $1,911,000 $1,514,347 $1,337,483 $1,376,858 $735,607 -20.8% -11.7% 2.9% -46.6% -21.2% Source: NIH Funding Report as of Oct 12, 2017, US. Department of Health and Human Services PHS, Research Finance Analytics 8
FY17 Comparison of NIH Funding by Institute versus PHS PHS Relative Share of FY17 NIH Funding x Institute 100% 6% 7% 8% 9% 2% 17% 90% 4% 6% 7% 3% 30% 2% 2% 3% 2% 2% 2% 80% 3% 3% 30% 6% 3% 5% 6% 4% 8% 70% 5% 9% 13% 7% 6% 3% 4% 60% 7% 8% 10% 4% 50% 7% 100% 26% 7% 10% 5% 40% 20% 70% 50% 10% 15% 30% 23% 16% 20% 13% 9% 10% 14% 14% 13% 13% 10% 0% NIH MGH BWH McL SRH IHP PHS NCI NIAID NHLBI NIGMS NIA NIDDK NINDS NIMH NICHD NIDA NIAMS NIBIB All Other Source: NIH Funding Report, US. Department of Health and Human Services PHS, Research Finance Analytics 9
Partners- New Award Funding by Quarter Includes Total Budget Amount For All Years of Project (in millions) Quarterly Percentage of Total Year DHHS and Other Federal Other Federal Industry/ Corporate All Other Sponsors All Year 2012 Quarter DHHS $ 646.4 Foundations Non-Profit $ 67.6 22.2 14.5 6.2 24.7 110.8 44.2 22.7 14.3 29.6 116.8 34.8 32.1 13.1 36.7 103.1 22.3 13.2 10.9 56.7 128.0 24.9 19.4 29.0 54.6 167.1 45.9 87.9 9.6 23.7 Grand Total $ 1,178.6 Sponsors $ 38.2 4.3 4.6 2.3 26.9 53.4 8.1 9.3 4.6 31.4 51.6 2.8 0.7 28.3 19.9 64.4 1.2 1.6 29.3 32.3 40.7 1.1 0.8 11.4 27.3 85.6 4.0 2.4 52.8 26.4 $ 188.9 18.6 36.4 44.0 89.9 269.3 29.0 34.3 36.0 170.0 251.2 36.6 46.1 68.9 99.7 222.5 32.8 25.2 48.7 115.7 237.7 24.6 46.7 50.0 116.5 132.2 32.1 37.3 31.9 30.9 $ 163.4 82.0 16.1 31.5 33.8 193.3 125.1 16.4 26.0 25.8 118.1 24.5 15.2 15.5 62.9 142.1 47.6 24.3 25.4 44.8 139.2 40.7 18.5 45.2 34.8 133.9 55.5 29.5 19.0 29.8 $ 74.1 26.9 23.7 12.0 11.5 55.3 6.3 16.0 15.4 17.6 99.5 21.2 42.4 14.0 22.0 67.7 15.7 14.6 11.8 25.6 90.3 31.0 7.5 33.2 18.7 59.7 5.8 19.2 12.3 22.3 2012-FQ1 2012-FQ2 2012-FQ3 2012-FQ4 37.3 47.9 200.6 360.6 579.0 20.0 86.0 129.4 343.6 1,058.1 35.7 341.1 320.8 360.5 728.9 36.7 76.2 161.3 454.7 816.1 32.3 143.2 192.3 448.3 713.6 56.7 134.9 137.0 385.0 191.3 143.2 296.7 547.4 1,261.1 232.6 184.8 225.6 618.0 1,695.4 155.6 477.5 460.6 601.7 1,328.7 156.3 155.2 287.4 729.8 1,452.0 154.6 236.2 361.1 700.0 1,292.0 199.9 311.3 262.7 518.0 16% 12% 25% 47% 6% 8% 29% 57% 2013 2013-FQ1 2013-FQ2 2013-FQ3 2013-FQ4 18% 15% 18% 49% 5% 15% 21% 59% 2014 2014-FQ1 2014-FQ2 2014-FQ3 2014-FQ4 9% 29% 27% 35% 3% 31% 32% 34% 2015 2015-FQ1 2015-FQ2 2015-FQ3 2015-FQ4 12% 12% 21% 55% 5% 10% 24% 61% 2016 2016-FQ1 2016-FQ2 2016-FQ3 2016-FQ4 11% 16% 25% 48% 4% 17% 24% 55% 2017 2017-FQ1 2017-FQ2 2017-FQ3 2017-FQ4 15% 24% 21% 40% 8% 17% 24% 51% Note: Award quarter/year based on start date of parent award. PHS, Research Analytics, Micro Strategy Awards FY12-FY17, data as October 19, 2017. Partners includes MGH, BWH, MCL, SRH, PHS, NWH, and IHP. 10
DHHS New Award Funding FY13-Q4 FY17 Includes 5 mega awards for $300M, with very low IDC 500,000,000 450,000,000 400,000,000 350,000,000 300,000,000 250,000,000 Full Rate Awards 200,000,000 All Awards 150,000,000 100,000,000 50,000,000 0 Q1 Q2 Q3 Q4 Q1 Q2 Q3 Q4 Q1 Q2 Q3 Q4 Q1 Q2 Q3 Q4 Q1 Q2 Q3 Q4 2013 2014 2015 2016 2017 In FY17, 85% of DHHS New Award $ are at the Full Onsite Rate versus 83% in FY16, 86% in FY15, 53% in FY14, and 83% in FY13. 11 Last Updated 4/19/2025
Proposal Trends by Fiscal Year FY17 Proposals down 3% vs. FY16 due to a 20% decrease in Foundations Proposal Submissions by Fiscal Year 9,000 278 8,000 238 542 258 497 533 260 242 7,000 1,028 899 593 510 848 695 705 6,000 935 1,176 1,162 1,282 1,231 5,000 1,661 1,506 1,452 4,000 1,186 1,220 3,000 1,506 1,535 1,495 1,357 1,329 2,000 2,260 2,188 1,000 2,023 1,888 1,883 0 2013 2014 2015 2016 2017 DHHS Federal Subcontracts Non-Profit Foundations Industry/Corporate All Other Sponsors Other Federal 12 Last Updated 4/19/2025
Headcount and FTE comparison Q4 FY17 YTD vs. Q4 FY16 YTD Research Headcount has increased by 428 (+3%) from Q4 FY16 YTD to Q4 FY17 YTD Research FTE s have increased by 239 (+3%) from Q4 FY16 YTD to Q4 FY17 YTD BWH MGH McLean SRH Total Q4 YTD Salary Job Group # Employees # of FTE # Employees # of FTE # Employees # of FTE # Employees # of FTE # Employees # of FTE Physician and PHD 1,423 603 2,051 1,006 79 47 23 4 3,477 1,659 Fellow, Intn, Resdt, and Trainee 963 588 1,533 948 74 46 20 8 2,554 1,590 2017 Other Weekly 2,391 1,385 4,032 2,366 363 201 60 28 6,721 3,980 Total 4,777 2,576 7,616 4,321 516 293 103 40 12,752 7,230 Physician and PHD Fellow, Intn, Resdt, and Trainee Other Weekly 1,444 659 1,920 971 73 44 20 4 3,364 1,678 920 579 1,465 949 71 40 13 6 2,435 1,573 2016 2,312 1,286 3,934 2,226 373 201 63 27 6,525 3,740 Total 4,676 2,524 7,319 4,146 517 285 96 36 12,324 6,991 Physician and PHD Fellow, Intn, Resdt, and Trainee (21) (56) 131 34 6 3 3 0 113 (19) 43 9 68 (1) 3 6 7 3 119 18 Difference Other Weekly 79 99 98 141 (10) (1) (3) 1 196 240 Total 101 52 297 175 (1) 8 7 4 428 239 % Change 2% 2% 4% 4% 0% 3% 7% 10% 3% 3% * Employees working at multiple institutions will be counted as one in the "Total" column. Therefore, employee totals by institution will not sum across. 13 PHS, Research Finance Analytics, Micro Strategy Reporting
BWH Research Revenue Trends Total BWH research revenues exceeded $664M, an increase of 4%, driven primarily by increased Federal Subcontract, Non-Profit, and DHHS sponsored research. BWH Research Revenues $700 $59 $52 $34 $61 $34 $600 $41 $33 $26 $28 $36 $25 $33 $46 $32 $27 $33 $26 $26 $29 $29 $32 $500 $93 $27 $32 $97 $140 $93 $112 $119 $25 $36 $95 $33 $72 $34 $88 $59 $400 $60 $19 $27 $ Millions $57 $53 $28 $53 $29 $16 $61 $70 $10 $49 $14 $22 $46 $58 $52 $300 $46 $39 $38 $38 $200 $363 $361 $350 $336 $319 $314 $300 $267 $259 $247 $235 $100 $0 2007 2008 2009 2010 2011 2012 2013 2014 2015 2016 2017 DHHS ARRA Other Federal Federal Subcontracts Industry/Corporate Non-Profit Foundations All Other Sponsors Source: PHS Research Revenues FY07- FY17 Actual. Note: Research Activity, excludes Other Science and P&L adjustments . 14
BWH Research Revenue Sponsor Mix Overall Federal Sponsor mix improved to 68%, with a 2% point increase in Federal Subcontracts. BWH Research Revenue Sponsor Mix 100% 5% 5% 5% 7% 7% 8% 8% 8% 8% 9% 10% 4% 5% 6% 4% 90% 7% 6% 6% 7% 6% 5% 4% 5% 5% 4% 5% 5% 4% 3% 5% 4% 4% 4% 80% 18% 13% 16% 19% 22% 14% 15% 14% 15% 16% 15% 70% 10% 9% 9% 9% 9% 11% 10% 9% 9% 10% 60% 8% 2% 2% 2% 7% 4% 7% 50% 40% 30% 59% 58% 56% 55% 55% 55% 55% 54% 51% 50% 48% 20% 10% 0% 2007 2008 2009 2010 2011 2012 2013 2014 2015 2016 2017 DHHS ARRA Other Federal Federal Subcontracts Industry/Corporate Non-Profit Foundations All Other Sponsors Source: PHS Research Revenues FY07- FY17 Actual. Note: Research Activity, excludes Other Science and P&L adjustments . 15
MGH Research Revenue Trends Total MGH research revenues exceeded $892M, an increase of 7%, driven primarily by increased DHHS, Federal Subcontract, Foundation, and Industry sponsored research. MGH Research Revenues $1,000 $900 $180 $800 $165 $149 $700 $129 $116 $104 $83 $141 $72 $95 $54 $62 $57 $61 $600 $74 $50 $97 $74 $ Millions $61 $58 $58 $65 $64 $67 $65 $81 $500 $51 $50 $49 $56 $59 $55 $66 $58 $55 $42 $34 $88 $60 $56 $46 $32 $61 $79 $74 $47 $20 $21 $49 $400 $26 $28 $64 $31 $27 $36 $42 $19 $30 $45 $34 $49 $26 $41 $42 $38 $20 $20 $23 $300 $200 $371 $369 $363 $353 $344 $343 $336 $322 $312 $298 $295 $100 $0 2007 2008 2009 2010 2011 2012 2013 2014 2015 2016 2017 DHHS ARRA Other Federal Federal Subcontracts Industry/Corporate Non-Profit Foundations All Other Sponsors Source: PHS Research Revenues FY07- FY17 Actual. Note: Research Activity, excludes Other Science and P&L adjustments . 16
MGH Research Revenue Sponsor Mix Overall Federal Sponsor mix fell to 54%, with a 1% point decrease in DHHS and Other Federal, partially offset by a 1% point increase in Federal Subcontracts. MGH Research Revenue Sponsor Mix 100% 13% 14% 14% 15% 15% 16% 17% 19% 19% 90% 20% 20% 6% 8% 9% 7% 9% 80% 9% 7% 4% 7% 8% 9% 9% 4% 8% 7% 8% 8% 6% 8% 70% 9% 7% 8% 9% 6% 7% 8% 7% 8% 7% 7% 8% 8% 7% 60% 7% 4% 7% 7% 8% 8% 8% 4% 8% 3% 3% 9% 9% 4% 3% 9% 6% 4% 50% 10% 6% 4% 4% 4% 3% 40% 30% 57% 55% 50% 49% 48% 47% 46% 45% 44% 42% 41% 20% 10% 0% 2007 2008 2009 2010 2011 2012 2013 2014 2015 2016 2017 DHHS ARRA Other Federal Federal Subcontracts Industry/Corporate Non-Profit Foundations All Other Sponsors Source: PHS Research Revenues FY07- FY17 Actual. Note: Research Activity, excludes Other Science and P&L adjustments . 17
McL Research Revenue Trends Total McL research revenues exceeded $50M, an increase of 7% versus FY16, driven primarily by increased DHHS and Federal Subcontract sponsored research. McL Research Revenues $50 $6 $45 $11 $6 $3 $6 $5 $11 $4 $7 $40 $3 $8 $4 $2 $1 $4 $2 $3 $3 $2 $3 $4 $4 $3 $4 $35 $2 $3 $1 $3 $4 $1 $3 $2 $2 $2 $3 $2 $4 $2 $1 $4 $1 $4 $1 $3 $4 $2 $30 $1 $2 $1 $1 $2 $2 $1 $2 $2 $1 $ Millions $4 $3 $2 $1 $1 $5 $2 $1 $1 $25 $4 $20 $30 $15 $28 $28 $28 $26 $26 $26 $25 $25 $24 $22 $10 $5 $0 2007 2008 2009 2010 2011 2012 2013 2014 2015 2016 2017 DHHS ARRA Other Federal Federal Subcontracts Industry/Corporate Non-Profit Foundations All Other Sponsors Source: PHS Research Revenues FY07- FY17 Actual. Note: Research Activity, excludes Other Science and P&L adjustments . 18
MCL Research Revenue Sponsor Mix Overall Federal Sponsor mix increased to 64%, with a 3% point increase in Federal Subcontracts and a 1% point increase in Other Federal. McL Research Revenue Sponsor Mix 100% 9% 10% 11% 11% 12% 13% 14% 15% 19% 90% 22% 23% 5% 8% 7% 7% 6% 5% 7% 4% 9% 80% 6% 5% 8% 8% 4% 10% 9% 6% 5% 6% 4% 8% 8% 6% 70% 6% 4% 8% 8% 4% 9% 4% 5% 4% 11% 10% 9% 3% 3% 4% 60% 7% 4% 50% 40% 63% 62% 30% 60% 59% 59% 58% 58% 57% 57% 55% 55% 20% 10% 0% 2007 2008 2009 2010 2011 2012 2013 2014 2015 2016 2017 DHHS ARRA Other Federal Federal Subcontracts Industry/Corporate Non-Profit Foundations All Other Sponsors Source: PHS Research Revenues FY07- FY17 Actual. Note: Research Activity, excludes Other Science and P&L adjustments . 19
SRH Research Revenue Trends Total SRH research revenues fell 3% to $6.8M, due primarily to reductions in Foundation sponsored research. SRH Research Revenues $9 $8 $0.2 $0.5 $0.4 $7 $0.7 $0.3 $0.4 $1.3 $0.6 $0.4 $6 $0.5 $0.5 $0.2 $3.2 $0.4 $5 $ Millions $2.8 $2.3 $0.2 $1.6 $1.8 $0.4 $4 $2.6 $0.2 $0.3 $3 $1.8 $1.9 $1.4 $1.3 $1.9 $1.8 $2.1 $0.2 $0.8 $0.1 $2 $0.4 $0.2 $0.2 $0.3 $0.3 $0.2 $0.4 $0.1 $0.5 $1.6 $1 $2.0 $1.9 $1.9 $1.6 $1.6 $1.5 $1.4 $1.4 $1.3 $1.0 $0.5 $0 2007 2008 2009 2010 2011 2012 2013 2014 2015 2016 2017 DHHS ARRA Other Federal Federal Subcontracts Industry/Corporate Non-Profit Foundations All Other Sponsors Source: PHS Research Revenues FY07- FY17 Actual. Note: Research Activity, excludes Other Science and P&L adjustments . 20
SRH Research Revenue Sponsor Mix Overall Federal Sponsor mix increased by 1% point to 73%, with a 3% point increase in Federal Subcontracts, partially offset by slight reductions in DHHS and Other Federal. SRH Research Revenue Sponsor Mix 100% 4% 4% 6% 10% 4% 6% 9% 90% 1% 10% 18% 7% 7% 6% 8% 80% 7% 17% 42% 70% 47% 39% 32% 41% 47% 23% 22% 26% 60% 17% 65% 50% 1% 5% 40% 14% 20% 19% 3% 26% 5% 23% 29% 30% 5% 52% 48% 20% 35% 34% 29% 28% 28% 23% 23% 22% 10% 20% 0% 2007 2008 2009 2010 2011 2012 2013 2014 2015 2016 2017 DHHS ARRA Other Federal Federal Subcontracts Industry/Corporate Non-Profit Foundations All Other Sponsors Source: PHS Research Revenues FY07- FY17 Actual. Note: Research Activity, excludes Other Science and P&L adjustments . 21
Immediate Sponsor Mix Analytics Research Type Sponsor Group FY17 Q4 YTD FY16 Q4 YTD FY17 vs FY16 Institution % Increase FY17 vs FY16 Total Revenue Total Revenue % Mix Total Revenue Total Revenue % Mix Incr FY17 vs FY16 All Other Sponsors DHHS Foundations Industry/Corporate Non-Profit Other Federal Total All Other Sponsors DHHS Foundations Industry/Corporate Non-Profit Other Federal Total All Other Sponsors DHHS Foundations Industry/Corporate Non-Profit Other Federal Total All Other Sponsors DHHS Foundations Industry/Corporate Non-Profit Other Federal Total 59,063,710 363,454,436 33,102,676 95,374,759 101,319,692 12,427,458 664,742,732 11,184,451 27,506,258 2,202,238 1,938,236 6,472,424 831,104 50,134,710 182,397,359 370,523,849 83,418,937 74,549,662 151,312,404 30,795,173 892,997,385 290,127 1,914,036 655,742 1,049,519 1,586,537 1,319,265 6,815,226 1,614,690,052 9% 55% 5% 14% 15% 2% 100% 22% 55% 4% 4% 13% 2% 100% 20% 41% 9% 8% 17% 3% 100% 4% 28% 10% 15% 23% 19% 100% 100% 59,332,001 350,328,277 34,067,241 96,402,410 83,883,436 13,176,835 637,216,240 10,587,239 25,602,153 2,633,260 1,596,265 5,845,784 570,252 46,834,953 162,557,247 352,604,552 76,327,373 63,234,467 144,473,592 30,439,563 829,636,794 93,195 2,009,562 1,287,631 948,717 1,260,195 1,423,922 7,023,222 1,520,711,209 9% 55% 5% 15% 13% 2% 100% 23% 55% 6% 3% 12% 1% 100% 20% 43% 9% 8% 17% 4% 100% 1% 29% 18% 14% 18% 20% 100% 100% (268,291) 13,126,159 (964,564) (1,027,651) 17,436,256 (749,377) 27,526,492 597,212 1,904,105 (431,022) 341,970 626,640 260,852 3,299,757 19,840,112 17,919,298 7,091,564 11,315,195 6,838,812 355,609 63,360,590 196,932 (95,526) (631,889) 100,801 326,342 (104,657) (207,996) 93,978,843 0% 4% -3% -1% 21% -6% 4% 6% 7% -16% 21% 11% 46% 7% 12% 5% 9% 18% 5% 1% 8% 211% -5% -49% 11% 26% -7% -3% 6% BWH McLean MGH SRH Total 22 Note: Immediate Sponsor expenditures as a percent of Total Research excluding All Other Science, Accruals, and P&L Adjustments.
Total Research Revenue Trends FY09-FY17 (without Other Science) Institution 2009 258,627,132 1,937,923 6,210,368 45,909,097 70,486,896 18,537,310 32,751,979 35,566,500 470,027,205 23,541,407 107,676 426,566 4,743,678 4,250,606 1,026,822 3,391,382 3,831,515 41,319,653 312,013,061 2,691,181 19,706,944 49,195,802 46,935,143 34,145,502 55,901,192 97,429,812 618,018,636 529,834 2010 267,336,850 39,478,209 7,822,353 49,170,598 88,238,412 25,352,307 31,582,170 28,525,387 537,506,287 21,548,363 3,891,731 389,426 3,104,917 1,458,517 727,846 2,444,255 3,976,214 37,541,268 321,726,749 40,740,615 19,407,545 49,074,173 41,540,916 49,647,165 58,380,747 94,939,668 675,457,578 1,413,966 139,135 (1,510) 1,885,108 41,856 296,800 212,538 58,558 4,046,451 2011 2012 2013 335,552,880 9,625,426 10,162,631 56,632,190 111,917,909 26,338,471 24,577,528 40,866,037 615,673,073 28,492,642 478,468 1,933,132 1,191,438 1,775,172 2,137,490 2,960,277 6,092,635 45,061,254 362,757,862 8,592,520 27,229,401 61,115,929 55,074,329 64,606,952 56,834,215 128,567,995 764,779,203 1,592,855 (15,419) 1,788,038 2,843,949 44,496 440,371 40,666 107,674 6,842,629 2014 314,460,232 227,430 9,985,270 60,648,387 94,569,877 26,697,436 32,178,732 46,093,294 584,860,657 26,191,452 2015 361,030,275 32,431 12,127,626 58,986,392 97,174,552 25,652,431 35,955,821 52,376,776 643,336,304 25,428,143 2016 350,323,478 26,040 13,228,322 59,710,231 93,436,085 28,560,610 33,152,812 60,752,613 639,190,190 25,602,153 2017 363,454,436 DHHS ARRA Other Federal Federal Subcontracts Industry/Corporate Non-Profit Foundations All Other Sponsors Total DHHS ARRA Other Federal Federal Subcontracts Industry/Corporate Non-Profit Foundations All Other Sponsors Total DHHS ARRA Other Federal Federal Subcontracts Industry/Corporate Non-Profit Foundations All Other Sponsors Total DHHS ARRA Other Federal Federal Subcontracts Industry/Corporate Non-Profit Foundations All Other Sponsors Total 299,698,810 46,460,578 9,169,047 52,932,251 118,997,254 32,602,632 28,313,817 34,095,886 622,270,276 25,664,382 3,793,838 979,278 3,330,788 1,455,952 1,838,923 2,361,675 4,641,235 44,066,072 343,923,024 44,701,024 25,976,642 55,677,986 48,908,020 58,446,250 62,338,577 103,530,747 743,502,271 1,512,208 226,925 231,855 1,828,506 24,025 428,284 165,172 66,215 4,483,189 318,661,898 22,178,809 9,495,838 52,833,871 139,607,348 27,430,723 26,064,253 34,483,210 630,755,950 25,238,047 1,795,653 1,929,823 1,453,858 2,225,958 2,643,990 3,063,895 4,379,832 42,731,056 368,723,154 17,060,567 27,529,886 60,071,936 51,255,616 60,722,322 54,499,380 116,107,418 755,970,278 1,553,612 255,861 790,598 2,613,435 43,260 242,690 14,506 64,946 5,578,907 12,427,304 72,322,648 92,974,991 32,230,330 32,594,445 58,738,579 664,742,732 27,506,258 BWH 2,167 (0) 570,252 2,095,897 1,590,768 3,620,020 2,628,418 10,727,444 46,834,953 352,604,552 831,104 3,638,160 1,761,357 3,019,340 2,202,238 11,176,253 50,134,710 370,523,849 1,422,603 1,701,885 1,536,709 2,433,479 3,757,905 6,596,450 43,642,651 336,108,829 988,720 26,136,127 63,559,278 55,493,891 64,872,792 50,208,429 141,360,117 738,728,183 1,863,760 680,000 1,475,423 1,636,852 2,669,212 3,366,545 8,405,805 43,661,980 343,075,037 (11,230) 33,979,962 73,506,039 57,628,016 64,152,751 60,973,984 148,768,843 782,073,402 1,399,249 McLean 30,310,135 78,821,132 59,127,756 74,171,527 71,672,190 164,578,239 831,285,532 2,009,562 30,712,630 87,908,712 67,420,246 74,067,604 82,563,360 179,800,984 892,997,385 1,914,036 MGH 1,423,922 1,636,306 113,950 491,615 1,251,733 96,134 7,023,222 1,524,333,896 1,319,265 1,756,678 359,363 545,570 631,609 288,704 6,815,226 1,614,690,052 3,142 1,915,449 3,172,890 385,524 481,453 247,782 95,021 8,161,880 2,089,101 2,301,380 147,030 408,363 689,772 56,155 7,091,051 1,476,162,736 1,572,832 105,836 100,685 90,378 29,891 2,432,597 1,131,798,092 1,254,551,584 1,414,321,808 1,435,036,191 1,432,356,158 1,375,393,371 SRH Total 23 Note: Total Research Activity expenditures excluding All Other Science, Accruals, and P&L Adjustments.
Total Research Revenue Trends FY09-FY17 (with Other Science) Institution 2009 2010 267,206,621 39,478,209 7,822,353 58,344,488 88,238,412 26,039,041 31,582,170 33,166,950 551,878,245 21,548,363 3,891,731 389,426 3,228,817 1,458,517 750,942 2,444,255 4,468,346 38,180,396 321,727,534 40,740,615 19,407,545 53,873,976 41,540,916 23,575,392 58,380,747 136,563,012 695,809,735 1,413,966 139,135 (1,510) 1,885,108 41,856 296,800 212,538 58,558 4,046,451 1,289,914,828 1,449,046,514 2011 299,698,810 46,460,578 9,169,047 62,100,910 118,997,254 32,887,359 28,313,817 38,776,750 636,404,526 25,664,382 3,793,838 979,278 3,362,094 1,455,952 1,931,454 2,361,675 4,804,352 44,353,027 343,923,024 44,701,024 25,976,642 60,410,807 48,908,020 27,845,330 62,362,097 149,678,825 763,805,771 1,512,208 226,925 231,855 1,828,506 24,025 428,284 165,172 66,215 4,483,189 2012 318,661,898 22,178,809 9,495,838 61,129,132 139,607,348 27,505,296 26,064,253 40,918,483 645,561,058 25,238,047 1,795,653 1,929,823 1,446,374 2,225,958 2,761,632 3,063,895 4,551,732 43,013,114 368,723,154 17,060,567 27,529,886 64,308,460 51,255,616 30,566,495 54,485,860 162,144,190 776,074,228 1,553,612 255,861 790,598 2,613,435 43,260 242,690 14,506 64,946 5,578,907 1,470,227,307 1,469,015,856 2013 335,515,933 9,625,426 10,162,631 64,824,194 111,917,909 26,345,344 24,577,528 47,606,268 630,575,235 28,492,642 478,468 1,933,132 1,191,438 1,775,172 2,254,055 2,960,277 6,299,078 45,384,262 362,743,041 8,592,520 27,229,401 66,073,619 55,074,329 34,858,949 56,834,215 174,807,657 786,213,731 1,592,855 (15,419) 1,788,038 2,843,949 44,496 440,371 40,666 107,674 6,842,629 2014 314,460,232 227,430 9,985,270 68,465,654 94,569,877 26,703,432 32,178,732 53,558,107 600,148,733 26,191,452 2015 361,151,356 32,431 12,127,626 66,552,148 97,174,552 25,660,935 35,955,821 59,654,307 658,309,177 25,428,143 2016 350,322,752 26,040 13,228,322 67,668,866 93,436,085 28,569,162 33,152,812 67,630,365 654,034,403 25,602,153 2017 363,454,436 258,651,580 1,937,923 6,210,368 53,859,106 70,486,896 19,040,573 32,751,979 39,694,939 482,633,365 23,541,407 107,676 426,566 4,832,810 4,250,606 1,030,487 3,391,382 4,485,460 42,066,395 311,969,392 2,691,181 19,706,944 54,193,266 46,935,143 14,317,637 55,901,192 131,245,696 636,960,452 529,834 DHHS ARRA Other Federal Federal Subcontracts Industry/Corporate Non-Profit Foundations All Other Sponsors Total 13,429,673 79,841,701 92,974,991 32,514,772 32,665,193 70,594,770 685,475,536 27,506,258 BWH DHHS ARRA Other Federal Federal Subcontracts Industry/Corporate Non-Profit Foundations All Other Sponsors Total 2,167 (0) 1,422,603 1,701,885 1,536,709 2,541,448 3,757,905 6,713,105 43,867,275 336,098,391 988,720 26,136,127 68,591,837 55,493,891 30,672,185 50,208,429 191,736,741 759,926,321 1,863,760 680,000 1,475,423 1,636,852 2,649,826 3,366,545 8,480,811 43,717,600 343,075,034 (11,230) 33,979,962 78,753,268 57,628,016 29,530,252 60,973,984 196,940,379 800,869,666 1,399,249 570,252 2,095,897 1,590,768 3,619,347 2,628,418 11,038,636 47,145,472 352,612,369 831,104 3,638,160 1,761,357 3,019,340 2,202,238 10,936,752 49,895,209 371,025,664 McLean DHHS ARRA Other Federal Federal Subcontracts Industry/Corporate Non-Profit Foundations All Other Sponsors Total 30,310,135 83,706,890 59,127,756 39,265,798 71,672,190 213,068,312 849,763,451 2,009,562 30,712,630 94,504,494 67,420,246 35,245,941 83,007,186 230,047,109 911,963,270 1,914,036 MGH DHHS ARRA Other Federal Federal Subcontracts Industry/Corporate Non-Profit Foundations All Other Sponsors Total 3,142 1,915,449 3,172,890 385,524 481,453 247,782 95,021 8,161,880 1,412,104,209 2,089,101 2,301,380 147,030 408,363 689,772 56,155 7,091,051 1,509,987,494 1,423,922 1,636,306 113,950 491,615 1,251,733 96,134 7,023,222 1,557,966,548 1,319,265 1,756,678 359,363 545,570 631,609 288,704 6,815,226 1,654,149,241 1,572,832 105,836 100,685 90,378 29,891 2,432,597 1,164,092,809 SRH Total 24 Note: Total Research Activity expenditures including All Other Science, Accruals, and excluding P&L Adjustments.
Research Activity Type Mix x Institution FY17 vs FY16 Q4 YTD Activity Type Mix 100% 5% 5% 5% 5% 6% 6% 7% 7% 9% 9% 90% 8% 14% 13% 11% 21% 21% 80% 29% 31% 31% 33% 25% 70% 27% 33% 33% 60% 33% 32% Training/ Other 50% Clinical Trial 34% 32% 40% 52% 51% Other Clinical Research 30% Basic Science Research 58% 54% 47% 46% 20% 40% 40% 30% 30% 10% 14% 13% 0% FY17 FY16 FY17 FY16 FY17 FY16 FY17 FY16 FY17 FY16 BWH MGH McLean SRH Overall PHS The Research Activity mix in FY17 is similar to FY16 results. Note: Expenditures by activity type as a percent of Total Research Revenue , excluding All Other Science, Accruals, and P&L Adjustments. 25 PHS, Research Finance Analytics
Proposal Trending Q4 YTD FY17 vs. FY16 Proposal Volumes Requested Budgets Institution Sponsor Type 2016 2017 Difference % Change 2016 20,691,343 1,720,163,075 354,580,435 114,425,339 4,080,301 82,249,285 89,091,594 -6% 2,385,281,372 -3% 13,434,776 6% 2,471,420,290 2% 423,962,145 -20% 186,870,447 -11% 19,652,567 13% 119,958,238 -17% 190,921,851 -1% 3,426,220,314 -23% 1% 151,405,729 -19% 12,331,670 6% -40% 35% 2017 11,116,357 1,675,270,014 303,455,810 261,494,220 3,327,929 74,584,242 109,923,985 2,439,172,557 9,860,580 2,308,043,374 394,542,557 281,129,816 5,825,118 129,648,022 136,920,305 3,265,969,772 200,000 183,401,892 12,290,174 4,073,137 Difference (9,574,986) (44,893,061) (51,124,625) 147,068,881 (752,372) (7,665,043) 20,832,391 53,891,185 (3,574,196) (163,376,916) (29,419,588) 94,259,369 (13,827,449) 9,689,784 (54,001,546) (160,250,542) % Change All Other Sponsors DHHS Federal Subcontracts Foundations Industry/Corporate Non-Profit Other Federal Total All Other Sponsors DHHS Federal Subcontracts Foundations Industry/Corporate Non-Profit Other Federal Total All Other Sponsors DHHS Federal Subcontracts Foundations Industry/Corporate Non-Profit Other Federal Total All Other Sponsors DHHS Federal Subcontracts Foundations Industry/Corporate Non-Profit Other Federal Total All Other Sponsors DHHS Federal Subcontracts Foundations Industry/Corporate Non-Profit Other Federal Total 141 835 675 463 382 612 131 3,239 367 1,204 779 667 580 850 143 4,590 106 845 652 357 344 634 109 3,047 355 1,276 797 535 514 964 118 4,559 (35) 10 (23) (106) (38) -25% 1% -3% -23% -10% 4% -17% -46% -3% -14% 129% -18% -9% 23% 2% -27% -7% -7% 50% -70% 8% -28% -5% 59% 21% 0% 26% -100% 52% BWH 22 (22) (192) (12) 72 18 (132) (66) 114 (25) (31) (7) MGH 31 130 63 32 25 37 24 131 51 34 15 50 10 315 126,124 73,876 1 31,996,163 (41,496) 852,703 (91,688) 1,578,270 8,424,561 42,792,389 (75,001) (222,752) (2,727,997) 6,938,383 (630,000) 318,164 (3,018,202) 582,595 (13,150,307) (176,496,566) (83,313,706) 249,119,336 (15,301,509) 3,921,175 (27,762,796) (62,984,373) (12) 2 3,220,434 91,688 3,037,426 McLean (10) 13 10 (3) 0 4,615,696 8,424,561 213,005,460 0 0 318 -1% 133% -67% -72% -36% 0% 71% -75% -31% -9% 3% -2% -20% -11% 10% -14% -3% 6,004,557,538 170,213,071 75,001 11,635,090 3,378,892 3,472,940 630,000 585,314 3,065,544 22,842,781 34,327,244 4,354,624,184 794,253,142 307,989,160 24,454,556 205,830,263 283,078,989 25% 3 7 5 5 9 4 0 -100% -2% -81% 200% -100% 54% -98% 15 18 14 10 7 4 71 542 2,184 1,535 1,176 997 1,506 278 8,218 (10) (13) (5) 11,412,338 650,895 10,411,323 SRH 10 12 1 49 492 2,257 1,505 935 883 1,660 238 7,970 0 5 0 903,478 47,342 23,425,376 21,176,937 4,178,127,618 710,939,436 557,108,496 9,153,047 209,751,438 255,316,193 5,941,573,165 (3) (22) (50) 73 (30) (241) (114) 154 (40) (248) 3% -38% -4% -10% 81% -63% 2% -10% -1% Total Microstrategy parent proposal volume, Q4 FY17 YTD, Research Management totals excluding Confidentiality Agreements. Partners equals sum of MGH, BWH, MCL, SRH. 26 PHS, Research Finance Analytics
Proposal Volume Trending FY17 vs. FY16 -11% change versus Q4 FY16, down 3% overall FY17 vs FY16 Proposal Volumes x Sponsor Type 2,500 126 166 118 2,000 453 98 384 113 153 218 273 145 158 176 116 422 Proposals Submitted 274 417 328 1,500 458 408 174 398 239 363 246 251 369 197 201 16 233 37 92 36 107 1,000 49 267 426 248 420 344 314 427 100 403 79 367 500 337 697 668 651 649 589 527 340 327 0 2016-FQ1 2016-FQ2 2016-FQ3 2016-FQ4 2017-FQ1 2017-FQ2 2017-FQ3 2017-FQ4 Fiscal Quarter 2016 2017 DHHS Federal Subcontracts Other Federal Industry/Corporate Non-Profit Foundations All Other Sponsors Note: Q1 and Q2 proposal volumes tend to be the highest in terms of seasonality, followed by Q3 and Q4. 27 Microstrategy parent proposal volume, Q4 FY17 YTD, Research Management totals excluding Confidentiality Agreements. Partners equals sum of MGH, BWH, MCL, SRH
DHHS Success Rate by Institution Institution Fiscal Year 2012 2013 2014 2015 2016 2017 Proposals Awards Award $ 345,325,247 474,903,282 361,193,285 382,181,154 327,161,486 135,628,844 Success Rate 909 750 769 784 850 864 205 174 184 207 183 87 22.6% 23.2% 23.9% 26.4% 21.5% 10.1% BWH Institution Fiscal Year 2012 2013 2014 2015 2016 2017 Proposals Awards Award $ 325,691,756 399,606,288 350,364,821 414,786,053 459,341,911 182,315,281 Success Rate 1,075 1,036 1,040 1,174 1,228 1,291 243 248 248 281 265 139 22.6% 23.9% 23.8% 23.9% 21.6% 10.8% MGH Institution Fiscal Year 2012 2013 2014 2015 2016 2017 Proposals Awards Award $ 18,603,852 24,722,584 26,230,881 31,365,606 23,537,871 12,615,876 Success Rate 91 138 121 117 130 136 23 24 24 22 20 15 25.3% 17.4% 19.8% 18.8% 15.4% 11.0% MCL Institution Fiscal Year 2012 2013 2014 2015 2016 2017 Proposals Awards Award $ 689,620,855 899,232,154 737,788,987 828,332,813 810,041,268 330,560,001 Success Rate 2,075 1,924 1,930 2,075 2,208 2,291 471 446 456 510 468 241 22.7% 23.2% 23.6% 24.6% 21.2% 10.5% Partners 28 PHS, Research Finance Analytics Microstrategy parent proposal volume, Q4 FY17 YTD, Research Management totals excluding Confidentiality Agreements.


