Residents' High Ratings for City Services in District - Survey Findings 2019
"Discover the positive feedback from residents regarding city services in the district based on a public opinion survey conducted in 2019. Key findings include improved service ratings, top concerns, and prioritized services."
Uploaded on | 2 Views
Download Presentation

Please find below an Image/Link to download the presentation.
The content on the website is provided AS IS for your information and personal use only. It may not be sold, licensed, or shared on other websites without obtaining consent from the author. If you encounter any issues during the download, it is possible that the publisher has removed the file from their server.
You are allowed to download the files provided on this website for personal or commercial use, subject to the condition that they are used lawfully. All files are the property of their respective owners.
The content on the website is provided AS IS for your information and personal use only. It may not be sold, licensed, or shared on other websites without obtaining consent from the author.
E N D
Presentation Transcript
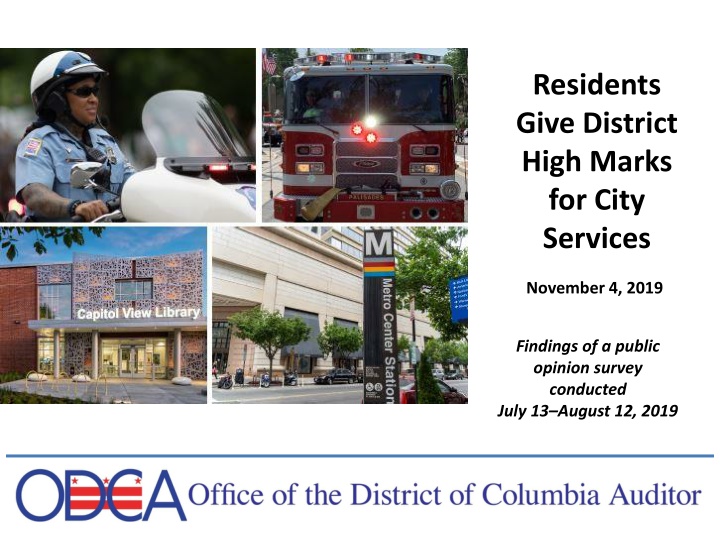
Residents Give District High Marks for City Services November 4, 2019 Findings of a public opinion survey conducted July 13 August 12, 2019
TABLE OF CONTENTS EVALUATION OF CITY SERVICES TOP PROBLEMS IN THE CITY EXECUTIVE SUMMARY 12 3 11 17 FINDINGS QUALITY OF INDIVIDUAL SERVICES COMBINATION OF QUALITY AND PRIORITY USE OF CITY SERVICES PRIORITY OF CITY SERVICES 26 21 30 31
The 2019 D.C. resident study was conducted by Belden Russonello Strategists and Emma White Research via landline, cell phone, and online from July 13-Aug 13, 2019. N=1,210 adult residents of Washington, D.C. (240 landline, 764 cell phone, 206 via opt-in online panel). Data were weighted to ensure representativeness across the city and by ward, based on U.S. Census American Community Survey 2013-2017 estimates. 1997 comparisons are to a survey conducted by Belden & Russonello for the D.C. Financial Responsibility and Management Assistance Authority (N=1,200 residents). Methods
Overall, residents rate city services positively. Half rate city services as excellent or good (50%), and only one in eight rate services poor or very poor (13%). This is a major improvement since 1997 when only 15% rated services excellent/good and nearly half (48%) said services were poor/very poor. The cost of living/affordable housing/gentrification tops residents list of concerns, followed by crime. This also marks a distinct shift from 1997, when residents reported the dominant problem facing the city was crime/violence/drugs and nothing else came close. Highlights: Overall
Individual city services are also largely rated positively, with ratings for nearly all services higher than in 1997. Highlights: Individual services Highest quality ratings Public libraries Fire protection Art and cultural events and programs Bus service Lowest quality ratings Providing affordable housing Services for people experiencing homelessness Street repair and maintenance
Residents were asked to prioritize the same set of 26 services. Combined with quality ratings we can identify services residents see as important but underperforming. Highlights: Priority services High priority and underperforming Highest priorities Quality of public schools across the city (45% top priority) Providing affordable housing for residents (45%) Safe drinking water (43%) Police protection against crime (42%) Services for people experiencing homelessness (39%) Quality of public schools in your neighborhood (38%) Providing affordable housing Quality of public schools across the city Services for people experiencing homelessness Mental health services Street repair/maintenance Job training and placement for the unemployed Drug treatment/recovery Police protection
Residents report largely positive experiences of 9-1-1 services and the DMV. Those who contacted the city about their taxes report more mixed experiences. Highlights: Use of services DMV 52% have contacted 65% of those report excellent/good service 9-1-1 26% have contacted 76% of those report excellent/good service Contacting government about taxes 17% have contacted 40% report excellent/good service
Demographic change since 1997: education/race 1997 2019 70% 65% 60% 54% 50% 46% 43% 37% 40% 36% 27% 27% 30% 20% 19% 20% 9% 10% 5% 0% HS or less Some college College degree + Black White Latino
Demographic change since 1997: Income 1997 2019 $90,000 $83,000 $80,000 $70,000 $60,000 $50,000 $50,000 $40,000 $30,000 $20,000 $10,000 $0 Median Income *Source: inflation-adjusted figures from U.S. Census
Top Problems in the City 33% Affordable housing/gentrification 23% Crime / Violence / Drugs 41% City government / Government 11% 6% Traffic / Congestion / Parking 2019 6% Homelessness 1997 5% Lack of Jobs 10% 5% Poor infrastructure 7% 4% Education / Child care 7% 0% 10% 20% 30% 40% 50% What do you say is the most important problem facing people living in the District today? (OPEN-END, ONE RESPONSE ALLOWED)
Top Problems in the City by Gender, Age, Race Affordable Housing Crime 50% 39% 40% 37% 37% 34% 33% 33% 32% 31% 29% 28% 30% 27% 24% 23% 23% 21% 20% 20% 18% 20% 16% 15% 10% 0% Total Men Women 18-29 30-44 45-59 60+ White Latino Black
Top Problems in the City by Education, Income Affordable Housing Crime 50% 42% 41% 38% 40% 36% 34% 34% 33% 29% 28% 30% 27% 24% 23% 23% 22% 20% 20% 17% 16% 14% 10% 0% Total < HS/HS Some Coll College Post Grad <$15K $15-50K $50-100k $100K +
Top Problems in the City by Homeownership, Tenure Affordable Housing Crime 50% 39% 40% 36% 33% 33% 32% 31% 30% 24% 23% 22% 22% 19% 20% 17% 10% 0% Total Homeowners Renters <5 years 6-10 years 10+ in DC
Top Problems in the City by Ward Affordable Housing Crime 50% 39% 39% 40% 37% 34% 34% 34% 34% 33% 31% 28% 30% 27% 24% 23% 22% 20% 20% 17% 13% 13% 10% 0% Total Ward 1 Ward 2 Ward 3 Ward 4 Ward 5 Ward 6 Ward 7 Ward 8
Overall Evaluation of City Services 2019 1997 8% 2019: 49% 1997: 15% Excellent 2% 42% Good 13% 36% Fair 35% 9% Poor 31% 2019: 13% 1997: 48% 4% Very poor 17% *In considering city government services in the District, would you say the quality of public services in general is excellent, good, fair, poor or 2% DK/REF 2% very poor? 0% 20% 40% 60%
Overall Evaluation of City Services by Gender, Race, Age % good or excellent 60% 56% 55% 54% 54% 52% 49% 50% 47% 47% 43% 43% 40% 30% 20% 10% 0% Total Men Women White Latino Black 18-29 30-44 45-59 60+
Evaluation of Services by Income, Education, Rent/Own, Tenure % good or excellent 70% 59% 58% 57% 60% 56% 52% 50% 49% 48% 48% 50% 44% 44% 44% 39% 40% 36% 30% 20% 10% 0%
Overall Evaluation of City Services by Ward % good or excellent 60% 57% 55% 55% 52% 49% 48% 50% 43% 43% 40% 40% 30% 20% 10% 0% Total Ward 1 Ward 2 Ward 3 Ward 4 Ward 5 Ward 6 Ward 7 Ward 8
Priority of City Services: Top Tier % extremely high 45% Providing affordable housing 45% Quality of public schools across the city*** 59% 43% Safe drinking water 45% 2019 42% Police protection against crime 54% 1997 39% Services for people experiencing homelessness 22% 38% Quality of public schools in your neighborhood 0% 10% 20% 30% 40% 50% 60% 70% * Now, I d like to read the list again, but this time please tell me, if you were advising the District government, what kind of priority would you give to each of the following services: an extremely high priority, a high priority, a middle priority, a low priority, or an extremely low priority...(% ** Data is not available for some 1997 categories because it was not asked about in 1997 survey *** 1997: Public schools
Priority of City Services: Middle Tier % extremely high 35% Mental health services 32% Ambulance and emergency medical services 40% 32% Job training and placement for unemployed 30% 2019 1997 31% Health clinics and other health services Provide health insurance through D.C's health exchange 28% 0% 5% 10% 15% 20% 25% 30% 35% 40% 45% * Now, I d like to read the list again, but this time please tell me, if you were advising the District government, what kind of priority would you give to each of the following services: an extremely high priority, a high priority, a middle priority, a low priority, or an extremely low priority...(% ** Data is not available for some 1997 categories because it was not asked about in 1997 survey
Priority of City Services: Middle Tier Cont. % extremely high 27% Fire protection 31% 27% Services and protections for seniors 27% Drug treatment and recovery programs 27% Street repair and maintenance 24% 2019 Moving to renewable energy to address climate change 1997 27% 27% After-school programs for youth 26% Metro-rail service 13% 0% 5% 10% 15% 20% 25% 30% 35% * Now, I d like to read the list again, but this time please tell me, if you were advising the District government, what kind of priority would you give to each of the following services: an extremely high priority, a high priority, a middle priority, a low priority, or an extremely low priority...(% ** Data is not available for some 1997 categories because it was not asked about in 1997 survey
Priority of City Services: Bottom Tier % extremely high 19% Bus Service 11% 16% Efforts to attract new business to D.C. 32% 16% Public libraries 16% 14% Enforcement of traffic laws 15% 2019 13% Arts and cultural events and programs 8% 1997 12% Processing property and income taxes 9% 11% Issuing and renewal of driver's licenses 7% 10% Car inspection and registration services 7% 0% 5% 10% 15% 20% 25% 30% 35% * Now, I d like to read the list again, but this time please tell me, if you were advising the District government, what kind of priority would you give to each of the following services: an extremely high priority, a high priority, a middle priority, a low priority, or an extremely low priority .
Providing affordable housing for residents is generally a top issue across the city. These groups are especially likely to report affordable housing as a very high priority: Priority of City Services Renters Newer residents; Those who have annual household incomes between $50,000 and $100,000
Quality of City Services: Top Tier % good or excellent 76% Public libraries 51% 67% Fire protection 48% 2019 66% Art and cultural programs 1997 57% 61% Bus service 55% 0% 10% 20% 30% 40% 50% 60% 70% 80% *Please tell me if you think the quality of each of the following specific public services is excellent, good, fair, poor, or very poor?
Quality of City Services: Middle Tier % good or excellent 56% Issuing/ renewal of drivers licenses 34% 55% Ambulance and emergency medical services 36% 53% Car inspection/ registration 35% 52% Metro rail service 79% 51% Safe drinking water 14% 2019 50% Efforts to attract new business to the city 1997 39% 42% Quality of schools in your neighborhood 38% Provide health insurance through D.C's health 34% After school programs for youth 0% 10% 20% 30% 40% 50% 60% 70% 80% 90% *Please tell me if you think the quality of each of the following specific public services is excellent, good, fair, poor, or very poor? ** Data is not available for some 1997 categories because it was not asked about in 1997 survey
Quality of City Services: Lower Tier % good or excellent Moving renewable energy to combat climate change 29% 11% Quality of public schools across the city*** 29% 8% Street repair and maintence 27% 1997 Mental health services 22% 2019 Drug treatment and recovery programs 22% 15% Services for people experiencing homelessness 18% 0% 5% 10% 15% 20% 25% 30% 35% *Please tell me if you think the quality of each of the following specific public services is excellent, good, fair, poor, or very poor? ** Data is not available for some 1997 categories because it was not asked about in 1997 survey; ***1997: Public schools
All demographic groups ranked providing affordable housing and services for people experiencing homelessness as the lowest quality services in the city. Quality of City Services
Priority by Quality Low priority High quality High priority High quality Higher Priority Public libraries Art and cultural events and programs Fire protection Car inspection and registration services Ambulance and emergency medical services Bus service Issuing and renewal of drivers licenses Providing health insurance through D.C.'s health exchange Efforts to attract new businesses to the District Health clinics and other health services After- school programs for youth Safe drinking water Metro-rail service The quality of public schools in your neighborhood Processing property and income taxes Services and protections for seniors Enforcement of traffic laws Higher quality Drug treatment and recovery programs D.C. Police protection against crime Moving to renewable energy to address climate change Job training and placement for unemployed The quality of public schools across the city Mental health services Street repair & maintenance Services for people experiencing homelessness Low priority Low quality High priority Low quality Providing affordable housing for residents
Use of City Services In the last 12 months, residents have Called, written, or gone to the Department of Motor Vehicle Services 52% 51% Called, written, or gone to the District Government regarding a question or problem with your taxes 17% 2019 20% 1997 26% Called 9-1-1 for a medical, fire or police emergency? 24% 0% 10% 20% 30% 40% 50% 60%
Experience contacting 9-1-1 Among those who have contacted within past 12 months 43% Excellent 31% 33% Good 31% 13% Fair 14% 2019 7% Poor 1997 13% 3% Very poor 11% 1% DK/REF *When you contacted 911, would you say the service you received was excellent, good, fair, poor, or very poor? N=311 0% 10% 20% 30% 40% 50%
Experience regarding taxes Among those who have contacted within past 12 months 15% Excellent 14% 25% Good 20% 25% Fair 22% 2019 18% Poor 1997 23% 17% Very poor 11% 1% DK/REF *When you contacted District Government regarding taxes, would you say the service you received was excellent, good, fair, poor, or very poor? N=201 0% 10% 20% 30% 40% 50%
Experience at DMV Among those who have contacted within past 12 months 31% Excellent 16% 34% Good 16% 20% Fair 28% 2019 9% Poor 1997 29% 6% Very poor 11% 0% DK/REF *When you contacted the District DMV, would you say the service you received was excellent, good, fair, poor, or very poor? N=632 0% 0% 10% 20% 30% 40% 50%
Key Takeaways The issues facing the city have changed. In 1997, crime dominated responses about the most important problem facing the city, but the next highest response offered by more than one in ten was that the DC government itself was the top problem (11%). This year the District government did not register as a problem or an issue. On the same question in 2019 the top issue cited was a combination of affordable housing and gentrification at 33 percent and that issue did not register for respondents in 1997. There is more consistency than divergence across subgroups in the city While we found some modest distinctions by age, gender, race and where people live, there was a significant degree of consistency on priorities and on the quality of District services. This was the case for those new to the District and for long-time residents. 35
Questions? Emma White Emma White Research emma@whiteresearch.com John Russonello Belden Russonello johnrussonello@brspoll.com 36
Call us: Get our updates: ODCA.mail@dc.gov Tweet us: https://twitter.com/ODCA_DC Visit us: www.dcauditor.org 202-727-3600 37
About ODCA The mission of the Office of the District of Columbia Auditor (ODCA) is to support the Council of the District of Columbia by making sound recommendations that improve the effectiveness, efficiency, and accountability of the District government. To fulfill our mission, we conduct performance audits, non- audit reviews, and revenue certifications. The residents of the District of Columbia are one of our primary customers and we strive to keep the residents of the District of Columbia informed on how their government is operating and how their tax money is being spent. 38

