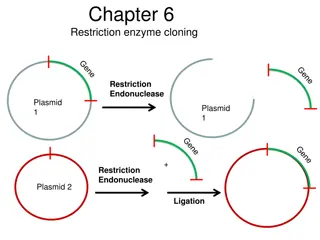
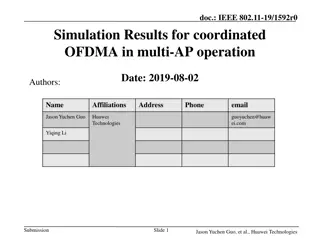
Restriction of 20MHz Operating Devices in OFDMA
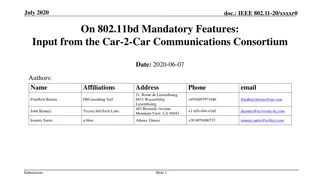
This document (.doc) titled IEEE 802.11-16/0906r0 addresses the restriction of 20MHz operating devices in OFDMA. The document, dated 2016-07-25, includes multiple authors from various affiliations such as Apple, Intel, Marvell, Broadcom, and Huawei, among others. It discusses implications and considerations related to operating devices within a 20MHz limitation in the context of OFDMA technology. The content showcases a collaborative effort from industry experts to outline guidelines and potential restrictions for such devices.

Download Presentation

Please find below an Image/Link to download the presentation.
The content on the website is provided AS IS for your information and personal use only. It may not be sold, licensed, or shared on other websites without obtaining consent from the author.If you encounter any issues during the download, it is possible that the publisher has removed the file from their server.
You are allowed to download the files provided on this website for personal or commercial use, subject to the condition that they are used lawfully. All files are the property of their respective owners.
The content on the website is provided AS IS for your information and personal use only. It may not be sold, licensed, or shared on other websites without obtaining consent from the author.
E N D
Presentation Transcript
Environmental Modeling Environmental Modeling and GIS Models
Access to Wilkeson GIAL Computer account Pro account Let me know if there are problems
1. Purpose of Models Simulate the real world Simplify the complex reality Explain underlying principles and relationships Predict the unknown in space or time Test hypothesis and scenarios
2. Components of a Model Assumptions starting conditions Elements - variables Function - relationships between variables Explanation - logic behind the functions Prediction using functions to assess a situation under different conditions and at other locations or time
3. Type of Models Research models a research tool Management models a management tool Conceptual models no numeric values or formula Theoretical models with numeric values or formula
3. Type of Models .. Physical models based on physical laws, first principle Empirical models based on observations, mechanism unknown Deterministic models based on known physical laws Stochastic models based on the concept of randomness and probability
3. Type of Models .. Differential models based on differential equations Matrix models based on matrix algebra Reductionistic models include as many details as possible Holistic models use general principles
3. Type of Models .. Static models variables not depend on time or space Dynamic models variables are a function of time and space Distributed models parameters depend on space and time Lumped models parameters are constants over an area
3. Type of Models .. Linear models first degree equations Non-linear models one or more equations not first degree Causal models input, logic, output are related to physics laws Black box models input and output are statistically related
4. Scales of Model Binary/Nominal no quantity, names yes/no, presence/absence, on/off, true/false, 1/0 Ranking/Ordinal high/medium/low excellent/very good/good/fair/poor Quantitative/Interval/Ratio absolute values, actual amount
5. Performance of Models Calibration calibrate model parameters based on the data that are used to develop the model Validation validate a model using independent data
5. Performance of Models .. Sensitivity analysis sensitivity of model output to changes in model input Error propagation error and uncertainty in input data transmitted to results through the modeling process
6. Link GIS and Models Direct use of GIS functions suitability index models and the Delphi approach Integrate GIS with statistical analysis use statistics to test a GIS model or use GIS to spatialize a statistical model Interface GIS with process models GIS provides input for models and displays the model output
6. Link GIS and Process Models .. Develop models in GIS Develop GIS in a model Interface GIS with a model Then and now
6. Link GIS and Process Models Technical interoperation Semantics interoperation Institutional interoperation
1. What is GIS? G: maps I: spreadsheets S: the system that puts the maps and spreadsheets together
Formal Definition of GIS A GIS is a computer-based system that provides for the collection, storage, analysis, and display of geo-referenced data A decision support system involving the integration of spatially referenced data in a problem solving environment
GIS Is Important Locations Networks Areas Because most information has a spatial component ESRI, GE SmallWorld
GIS Is Important It helps temporal reasoning as well S. H. Gage, J. Helly and M. Colunga, GIS/EM4 2000
GIS Integrates Various Information Social Factors Biodiversity Engineering Land Use Environmental Considerations It allows us to see the whole Courtesy: USGS
GIS and GIS GISystems Geographic Information Systems It refers to software, hardware It is used as a tool to support other research GIScience Geographic Information Science Study on GIS vs. study with GIS
Components in GIS Spatial locations Attributes Topology
Spatial Locations Specified with reference to a common coordinate system Geographic coordinate system (lat and long) UTM (Universal Transverse Mercator) State Plane
Geographic Coordinate System 900 latitude Lines of Latitude (East/West - parallels) Prime Meridian 00 Lines of Longitude (North/South - meridians) Central Parallel 00 courtesy: Mary Ruvane, http://ils.unc.edu/
UTM Zones courtesy: http://www.colorado.edu/geography/gcraft/
State Plane Zones courtesy: http://www.cnr.colostate.edu/class_info/nr502/lg3/datums_coordinates/spcs.html/
Difference between Systems UTM and many other coordinate systems are defined based on the geographic coordinate system
Attributes Attributes = variables, properties, etc. Four types of attribute values Nominal (river, grass, ..) Ordinal (high, medium, low) Interval (10oC, 20oC) Ratio (2.19, -96.57, ..)
Topology Spatial relationship between geographic features (points, lines, polygons) Adjacency Containment Connectivity and so on
GIS Data Models Vector points lines polygons networks Raster grids courtesy: Mary Ruvane, http://ils.unc.edu/
How GIS Is Used GIS by itself GIS = 100% We will discuss some of this Integrated with statistics GIS = 50%, statistics = 50% We will discuss some of this Integrated with process models GIS=10%, process models = 90%
2. GIS Modeling Conceptualize the Model Formulate the Model Implement the Model Calibrate, Validate, and Refine Models
2. GIS Modeling Conceptualize the Model Project Design (1) Identify the goal first - What is the problem e.g., where to put ATM machines e.g., where are the most appropriate places to cutold trees in a state park
2. GIS Modeling Conceptualize the Model.. Project Design (2) Identify the factors that affect the solution For the location of ATM machines factor 1: factor 2: factor 3: For cutting old trees in a state park?
2. GIS Modeling Formulate the Model Methodology Design (1) Find the spatial data for each factor. Use surrogate data if direct data are not available For the location of the ATM machines Factor 1: data = Factor 2: data = Factor 3: data =
2. GIS Modeling Formulate the Model.. Methodology Design.. (2) Identify spatial operators e.g., overlay, buffering neighborhood analysis, topographic analysis, spread function, stream function, viewshed analysis, network analysis, etc. For the location of the ATM machines Operator 1, 2,
2. GIS Modeling Implement the Model Methodology implementation Collect the data Run spatial operations Map the results
2. GIS Modeling Calibrate, Validate, and Refine Models The output is nothing more than a pretty picture without acceptability assessment - Go to field or use actual decision records as evidence - Use aerial photo or satellite images as surrogate evidence - Set a small set of data aside and use it later to validate the model results
2. GIS Modeling Calibrate, Validate, and Refine Models If all of above are impossible, Make sure all variables are significant for the model Make sure the model is appropriate
Major Events in This Semester Ad hoc job announcements ESRI recruiters coming to town Feb 24, 25 (Mon-Tue)
Positive Snail Prediction of Xichang Study Site using the land- cover map and field snail survey including 93 positive snail sites and 800 non-positive snail sites Positive snail 0.00 - 0.03 0.04 - 0.13 0.14 - 0.23 0.24 - 0.33 0.34 - 0.60 Lake 0 1,650 3,300 6,600 Meters


![BCH 462- Biotechnology & Genetic engineering [Practical]](/thumb/273367/bch-462-biotechnology-genetic-engineering-practical.jpg)