Restrictions on Economic Growth Due to PM2.5 NAAQS Compliance
Compliance with PM2.5 National Ambient Air Quality Standards (NAAQS) at specific levels (12.0 g/m3, 11.0 g/m3, 10.0 g/m3, 9.0 g/m3) imposes constraints on economic growth in areas where new projects must demonstrate attainment with NAAQS regulations. Stringent emission control measures and modeling guidelines are required for new construction to ensure ambient PM2.5 levels remain within permissible limits, impacting project feasibility and expansion in non-attainment regions. Background levels, EPA modeling, and violation predictions play vital roles in determining project approval based on air quality standards.

Uploaded on | 0 Views
Download Presentation

Please find below an Image/Link to download the presentation.
The content on the website is provided AS IS for your information and personal use only. It may not be sold, licensed, or shared on other websites without obtaining consent from the author. If you encounter any issues during the download, it is possible that the publisher has removed the file from their server.
You are allowed to download the files provided on this website for personal or commercial use, subject to the condition that they are used lawfully. All files are the property of their respective owners.
The content on the website is provided AS IS for your information and personal use only. It may not be sold, licensed, or shared on other websites without obtaining consent from the author.
E N D
Presentation Transcript
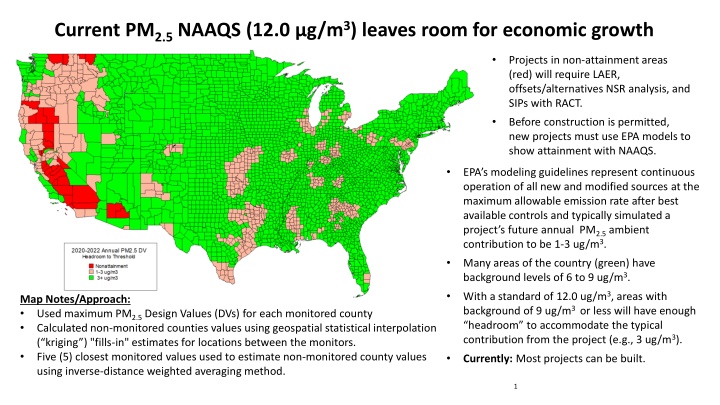
Current PM2.5 NAAQS (12.0 g/m3) leaves room for economic growth Projects in non-attainment areas (red) will require LAER, offsets/alternatives NSR analysis, and SIPs with RACT. Before construction is permitted, new projects must use EPA models to show attainment with NAAQS. EPA s modeling guidelines represent continuous operation of all new and modified sources at the maximum allowable emission rate after best available controls and typically simulated a project s future annual PM2.5 ambient contribution to be 1-3 ug/m3. Many areas of the country (green) have background levels of 6 to 9 ug/m3. With a standard of 12.0 ug/m3, areas with background of 9 ug/m3 or less will have enough headroom to accommodate the typical contribution from the project (e.g., 3 ug/m3). Map Notes/Approach: Used maximum PM2.5 Design Values (DVs) for each monitored county Calculated non-monitored counties values using geospatial statistical interpolation ( kriging ) "fills-in" estimates for locations between the monitors. Five (5) closest monitored values used to estimate non-monitored county values using inverse-distance weighted averaging method. Currently: Most projects can be built. 1
Immediate Impact of PM2.5 NAAQS at 11.0 g/m3 Limits economic growth in many areas of the country Before construction is permitted, new projects must use EPA models to show attainment with the NAAQS. EPA s modeling guidelines require assuming continuous operation of all new and modified sources at the maximum allowable emission rate using best available controls and typically simulate a project s future annual average PM2.5 ambient concentration to be 1-3 ug/m3. Many PM2.5 attainment areas have background levels of 6 to 9 ug/m3. With a standard of 11.0 ug/m3, areas with background as low as 8 ug/m3 will not have enough headroom to accommodate the ambient concentration conservatively simulated for the project (e.g., 3 ug/m3). Map Notes/Approach: Used maximum PM2.5 Design Values (DVs) for each monitored county Calculated non-monitored counties values using geospatial statistical interpolation ( kriging ) "fills-in" estimates for locations between the monitors. Five (5) closest monitored values used to estimate non-monitored county values using inverse-distance weighted averaging method. Impact: A violation of the NAAQS is predicted which effectively stops the project. 2
Immediate Impact of PM2.5 NAAQS at 10.0 g/m3 Many new or expanded manufacturing projects unachievable in red/pink colored areas Before construction is permitted, new projects must use EPA models to show attainment with the NAAQS. EPA s modeling guidelines require assuming continuous operation of all new and modified sources at the maximum allowable emission rate using best available controls and typically simulate a project s future annual average PM2.5 ambient concentration to be 1-3 ug/m3. Many PM2.5 attainment areas have background levels of 6 to 9 ug/m3. With a standard of 10.0 ug/m3, areas with background as low as 7 ug/m3 will not have enough headroom to accommodate the ambient concentration conservatively simulated for the project (e.g., 3 ug/m3). Impact: A violation of the NAAQS is predicted which effectively stops the project. Map Notes/Approach: Used maximum PM2.5 Design Values (DVs) for each monitored county Calculated non-monitored counties values using geospatial statistical interpolation ( kriging ) "fills-in" estimates for locations between the monitors. Five (5) closest monitored values used to estimate non-monitored county values using inverse-distance weighted averaging method. 3
Immediate Impact of PM2.5 NAAQS at 9.0 g/m3 Many new or expanded manufacturing projects unachievable in red/pink colored areas Before construction is permitted, new projects must use EPA models to show attainment with the NAAQS. EPA s modeling guidelines require assuming continuous operation of all new and modified sources at the maximum allowable emission rate using best available controls and typically simulate a project s future annual average PM2.5 ambient concentration to be 1-3 ug/m3. Many PM2.5 attainment areas have background levels of 6 to 9 ug/m3. With a standard of 9.0 ug/m3, areas with background as low as 6 ug/m3 will not have enough headroom to accommodate the ambient concentration conservatively simulated for the project (e.g., 3 ug/m3). Impact: Violation of the NAAQS is predicted which effectively stops the project. Map Notes/Approach: Used maximum PM2.5 Design Values (DVs) for each monitored county Calculated non-monitored counties values using geospatial statistical interpolation ( kriging ) "fills-in" estimates for locations between the monitors. Five (5) closest monitored values used to estimate non-monitored county values using inverse-distance weighted averaging method. 9 4
World Health Organization Global Ambient Concentrations of PM2.5 (ug/m3) South-East Asia 54 Eastern Mediterranean 51 Africa 39 Western Pacific 39 (WHO) Global 35 Europe 13 Americas 12 U.S. 8 0 10 20 30 40 50 60 Source: World Health Organization (WHO), Global Health Observatory (GHO), Sustainable Development Goals (SDG) Indicator 11.6.2: SDG Indicator 11.6.2 Concentrations of fine particulate matter (PM2.5) (who.int) 5
PM2.5 Emissions in Thousands of Tons per Year (2017 NEI) Fires 2491 Dust 902 Agriculture 795 Residential Fireplaces 337 Fuel Combustion 289 Sectors most impacted by lowering NAAQS Industrial Processes 270 Mobile Sources 247 Misc 210 Commercial Cooking 118 0 500 1000 1500 2000 2500 3000 6
Failed Permits from PM2.5NAAQS Changes 36 PSD permits from 13 industries in 19 states 14% (5) Annual Average PM2.5 ( g/m3) 8 ug/m3 At 11 ug, 36% fail 86% (31) 36% (13) At 10 ug, 50% fail Percentage of Projects Impacted as PM2.5 Lowers (36 PSD Permit Projects Total) EPA Preferred Range 9 ug/m3 At 9 ug, 78% fail At 8 ug, 86% fail 78% (28) Less than 8 ug 50% (18) 11 ug/m3 Massive investments and job losses at stake! 10ug/m3
 leaves room for economic")


")