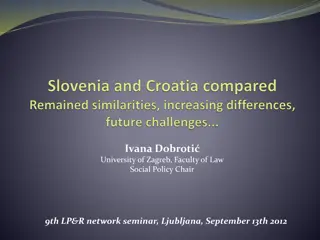
Restructuring Spending for Stability and Growth in Croatia
This review discusses the challenges Croatia faces in restructuring its public finance to achieve stability and promote growth. It covers issues such as fiscal adjustments, efficient use of EU funds, and the impact of macroeconomic imbalances. Despite past achievements, structural problems hinder the country's recovery, particularly in labor and product market efficiency.
Download Presentation

Please find below an Image/Link to download the presentation.
The content on the website is provided AS IS for your information and personal use only. It may not be sold, licensed, or shared on other websites without obtaining consent from the author.If you encounter any issues during the download, it is possible that the publisher has removed the file from their server.
You are allowed to download the files provided on this website for personal or commercial use, subject to the condition that they are used lawfully. All files are the property of their respective owners.
The content on the website is provided AS IS for your information and personal use only. It may not be sold, licensed, or shared on other websites without obtaining consent from the author.
E N D
Presentation Transcript
CROATIA: PUBLIC FINANCE REVIEW Restructuring Spending for Stability and Growth Sanja Madzarevic-Sujster June 2014
Roadmap Macro vulnerabilities and debt sustainability required fiscal adjustment of 4 pp of GDP over the medium term Maximizing the efficiency of using EU funds requirements for the efficient use of EU funds impact on growth and competitiveness required fiscal space of 1.8 pp of GDP per year Fiscal adjustment policy mix a combination of revenue, tax administration and, especially, social sectors, subsidies and public administration reform Can it be done? 2
Despite major development achievements Income per capita more than doubled between 1998 and 2008 (WB Atlas) high-income country At-risk-of-poverty rate fell; moderate inequality Relatively low and stable fiscal deficit, sustainable debt levels Inflation declined, stable exchange rate Institutional strengthening - judiciary, regulatory framework, competition policies 28thmember of the EU 3
the global crisis exposed macroeconomic imbalances Output loss over the last five years - 12% of 2008 GDP Unemployment rate more than doubled (17% in 2013); youth unemployment at 50% and the lowest labor force participation in EU (44% in 2013) 5-Year CDS Spreads: Croatia in the Eurozone Perspective Fiscal deficits increased to an average of 6% since 2009 and public debt doubled to 67% of GDP in 2013 External debt stayed elevated at 105% of GDP Croatia Estonia Germany Italy Latvia Slovenia 600 Basis points 500 400 300 200 100 0 1/3/2011 2/3/2011 3/3/2011 4/3/2011 5/3/2011 6/3/2011 7/3/2011 8/3/2011 9/3/2011 1/3/2012 2/3/2012 3/3/2012 4/3/2012 5/3/2012 6/3/2012 7/3/2012 8/3/2012 9/3/2012 1/3/2013 2/3/2013 3/3/2013 4/3/2013 5/3/2013 6/3/2013 7/3/2013 8/3/2013 9/3/2013 1/3/2014 10/3/2011 11/3/2011 12/3/2011 10/3/2012 11/3/2012 12/3/2012 10/3/2013 11/3/2013 12/3/2013 Source: Bloomberg. 4
Structural problems hold back a recovery Labor Market Efficiency Product Market Efficiency Source: World Economic Forum Global Competitiveness Index (2013-14). Ease of Doing Business Source: World Economic Forum Global Competitiveness Index (2013-14). Government Effectiveness Source: Doing Business (2013). Source: Worldwide Governance Indicators (2012). 5
Growing fiscal vulnerability Evolution of Croatia s Public Debt, % of GDP Croatia s Fiscal Performance, % of GDP Source: MoF, EUROSTAT, World Bank staff calculations. Fiscal data are shown per ESA95. Delayed response to longer-term structural and (temporary) cyclical shocks A large part of the fiscal deterioration is of a structural nature structural deficit at 4% of GDP requires remedies with longer-term effect The Government s medium-term fiscal framework needs to follow the EDP by 2016, primary expenditures to be reduced by 3.4 pp of GDP 6
Debt sustainability Public debt and interest payments higher and rose much faster than that of EU10 from the lower level in 2009 Interest payments only marginally lower than capital expenditures 17% of GDP in contingent liabilities (raising debt to 84% of GDP) That level of debt consistent with particularly weak growth performance, especially after the global crisis Croatia, EU10 and EU15: General Government Debt, Percent of GDP Croatia, EU10 and EU15: Interest Payments, Percent of GDP Note: General Government debt, as defined by Maastricht criteria, does not include guaranteed debt. Source: EUROSTAT, MoF, World Bank staff calculations and estimates. 7
Revenue composition General government revenues, % of total revenues General government revenues, % of GDP EU15 2013 46 13.5 13.3 14.2 2.5 2.4 EU10 2013 38.2 6.7 13.1 12.2 2.3 3.9 Croatia 2013 41 6.3 18.6 11.3 3 1.8 Total Revenues Direct taxes Indirect taxes Social contributions Sales Other current revenue Source: MoF, Eurostat, CROSTAT, staff calculation. Total revenues are about 3 percentage points higher than in EU10 Indirect taxation already overly high Nevertheless, there is still some scope for raising overall revenues. 8
Spending composition General government expenditures by economic and functional classification, % of GDP EU27 EU15 EU10 Croatia EU15 2013 49.5 46.1 6.7 10.6 2.9 1.2 22.2 2.5 3.4 EU10 2013 41.6 36.8 5.9 9 2.3 0.8 16.6 2.3 4.8 Croatia 2013 45.9 42.1 7.8 11.9 3.1 2.1 15.8 1.4 3.8 Total General public services Defence Public order and safety Economic affairs Environment protection Housing and community amenities Health Recreation, culture and religion Education Social protection 49.4 6.7 1.5 1.9 4.1 0.8 0.8 7.3 1.1 5.3 19.9 50 6.7 1.5 1.9 4.1 0.8 0.8 7.5 1.1 5.3 20.3 40.6 5.3 1.1 45.7 7.1 1.5 2.6 5.3 0.4 0.4 9.2 1.2 Total Expenditures Current Expenditures Consumption Wage bill Interest Subsidies Social benefits Current transfers Capital Expenditures 2 4.8 0.8 0.8 5.4 1.4 4.9 14 5 13.1 Source: MoF, Eurostat, CROSTAT, staff calculation. Croatia s spending level is 4.3 pp of GDP higher than in its EU10 peers Spending is particularly excessive for subsidies, public wages and consumption Social spending (health, education, and social protection) 3 pp of GDP higher than in EU10; education spending is on par with EU10 and EU15, while health is an outlier. General public services and economic affairs comparatively higher 9
Spending effectiveness Apart from addressing the level, effectiveness is an issue contradicts the amount of public resources allocated Performance of Government Services Education performance score Health system performance score Government effectiveness Source: Eurostat, http://ec.europa.eu/europe2020/pdf/themes/34_quality_of_public_administration_final.pdf 10
I. EU funds: an opportunity Croatia: First-Round Demand Effect of EU Funds, % of GDP Overall effect on economic growth positive, but could be lagged In the short term: modestly higher domestic demand (less than percent GDP); in the long run: they should contribute to economic growth from the supply side. During 2009-11, ESI represented over 70% of public investment in HU, SK, BG, LT, EE and over 50% in PL and CZ Demand impact was projected at around 3% of GDP per year in BG. 2.5 2.0 =0.9 =0.65 1.5 1.0 0.5 0.0 2013 2014 2015 2016 2017 2018 -0.5 Note: when =1 if there is no substitution. Source: World Bank Staff, based on Rosenberg and Sierhej (2007) 11
EU funds:and the fiscal challenge Net Impact of EU-related Funds on the Fiscal Deficit, ESA95, % of GDP Croatia: Net fiscal effect, cash basis, % of GDP 2014 1.7 2015 2.4 2016 2.3 2017 2.6 2018 2.9 2019 2020 3.2 Poland Hungary Lithuania Slovakia 0 EU related revenues Budget compensation Refunds on EU projects EU related expenditures 3 -0.2 0.1 0 0 0 0 0 0 -0.4 1.1 1.8 4.2 2.3 4.1 2.6 4.4 2.9 4.8 3 5 3.2 5.3 -0.6 3 -0.8 Contribution to EU 1.1 1.1 1.1 1.1 1.1 1.1 1 -1 2004 National co- and pre-financing 0.2 0.7 0.6 0.8 0.8 0.9 1 -1.2 2005 EU projects (funded by EU) Net fiscal impact Net Inflow of EU Funds 1.7 -1.3 0.3 2.4 -1.8 0.5 2.3 -1.7 0.6 2.6 -1.9 0.7 2.9 -1.9 0.9 3 3.2 -2.0 1.2 -1.4 2006 -2.0 1.0 -1.6 -1.8 Notes: The strict additionality principle assumed. Source: World Bank staff estimates, based on data from MFF 2014-2020 Note: Substitution as reported by the authorities for HU; maximum substitution according to EU rules for other Source: Rosenberg, Sierhej (2007) Fiscal space needs to be created to support their absorption, averaging up to 1.8% of GDP a year. Given Croatia s large fiscal deficit, it is important to manage EU-related funds through expenditure switching and substitution policies. 12
Policies for maximizing the efficient use of EU funds Link regional and national priorities with the Cohesion Policy priorities. Develop a clear strategic vision for national priorities and EU funds allocation at all levels. Switch away from lower priority spending, and substitute for domestic spending where possible. Build capacities related to the EU funds identification, preparation and implementation, especially at the local level. Set up a sound financial management system at all levels (local, regional, national) and in all EU funds beneficiaries. Establish comprehensive budget management systems to avoid different approaches to financing sources. 13
II. Revenue-side adjustment Croatia has the second highest revenue burden among the EU10 (41% of GDP) high indirect taxation and low direct taxes. Tax space (the amount of revenue given the country s economic strength rather than what the legislature has mandated) is negative. General government revenue, 2013, % of GDP Indirect and Direct Taxes in 2013, % of GDP Source: Eurostat 14
Revenue-side adjustmentrecommendations Introduce value-based modern property taxation. Could add up to 1.5% of GDP in new tax revenues over time Support fiscal devaluation through labor taxes while in parallel eliminate a large number of tax exemptions given to households and businesses Could bring an additional 1% of GDP to new revenues Design of personal income taxation and exemptions should reduce disincentives to work Strengthen and modernize Croatia s tax administration (CTA) to protect and expand the revenue base: a compliance risk management system; strong administration at HQ and the LTO strengthened; a streamlined network of regional and local tax offices; and a sound IT governance. 15
III. Rightsizing the government Cost of government services is high (even relative to the general price level and once controlled for per capita real income). Large size (17% of the labor force) growing number of public service employees Relatively low effectiveness and still highly politicized pay is largely based on seniority; not performance General government wage bill, % of GDP Public administration performance score Source: Eurostat 2013. Source: Eurostat, MoF, Weighted average for EU15 and Eu10. 16
Rightsizing the government Local government Unclear spending assignments large cities provide most of decentralized public services, questioning the existence of other LGUs. Only fire protection is almost completely decentralized. Excessive fragmentation 1/2 goes for wages and operational costs, while less than 1/5 for investment Limited fiscal independence 2/3 of revenues transfers from the national government (equalization system plays as disincentive to collect taxes) Persistently high vertical fiscal imbalances Average Inhabitant per Local Government, EU, 2011 Fiscal Imbalances, 2002 2012 60 70.0% Thousand 60.0% 50 50.0% 40 Municipalities 40.0% 30 Towns and Cities 30.0% Counties 20 Total LGs 20.0% 10 10.0% 0 0.0% PL PT BE BG SK AT IT SI FI SE NL IE CZ DFR CY LU ES LV LT EE MT RO DK EL DK HU HR 2003 2007 2010 2011 Source: Eurostat, MoF, Weighted average for EU15 and Eu10. Source: Eurostat 2013. 17
Rightsizing the governmentrecommendations Some 2% of GDP in cumulative savings could be achieved over the medium term Rationalization of the wage bill (targeted downsizing; the wage system reform; a full application of the HRMIS) Finalize provisions regulating criteria for the creation and management of agencies Professionalization and the introduction of performance based management practices Proceed with territorial reorganization or incentives to encourage joint provision of services Redefine spending responsibilities of local governments to avoid duplication and overlap of functions and to increase accountability of LGUs for service delivery Increase LGUs reliance on own-source revenues to reduce central government transfers Monitor fiscal operations of subnational governments to ensure fiscal prudence and alignment with the EDP 18
IV. Health Good health outcomes but at high cost (9% of GDP compared to 5.4% of GDP on average in the EU10) Rapid aging of the population non-communicable, chronic diseases and morbidity will continue increasing, with need for additional health and LTC. Chronic arrears (1% of GDP at the end-2013 or 15% of their revenues) Socio-economic and geographic disparities in health indicators in Croatia Inequality in Reported Long-term Illness in Croatia and Selected EU Countries, 2010 Health Expenditure and GNI per capita, 2010 Source: WHO, Global Health Expenditure Database. Croatia is red-shaded diamond. Source: Eurostat, EU SILC 19
Healthrecommendations Some 1% of GDP in savings could be achieved without adversely affecting the level and equity of service Consolidate health service networks by geographic areas to streamline services for acute cases (like in the National Plan) Create high-frequency lower-cost specialized centers for ambulatory diagnosis and treatment (could reduce unit costs by about 30 to 70%) Reduce further the referral rates in the primary health care and expand public health services to reduce the prevalence of behavioral risk factors Strengthen public FM systems to prevent arrears reoccuring Rationalize exempt copayment categories (40% of population) and adjust the complementary health insurance premium with actuarial standards Expand eHealth systems 20
V. Pension system Worsening demographic ratios: 17.3% of population over 65 and an old-age population dependency ratio of 23.8% Old age dependency ratio (65+/15-64) 30.0 25.0 20.0 System dependency rate of 1.17 and declining: low active coverage rate (only half of aged 15+ contribute), low formal labor participation, rising unemployment, early exit from the labor force 15.0 10.0 5.0 0.0 Bosnia and Herzegovina Slovenia Georgia Uzbekistan Montenegro Latvia Kosovo Kazakhstan Russian Federation Azerbaijan Estonia Belarus Tajikistan Turkmenistan Armenia Bulgaria Poland Turkey Moldova Ukraine Serbia Romania Lithuania Croatia Albania Czech Republic Macedonia, FYR Hungary Kyrgyz Republic Slovak Republic Minimum pensions are highly redistributive: the net replacement rate for minimum wage earners with 40 years of service is over 100%; 3% lower than for the average wage earners. System dependency rate (contributors/pensioners) transition countries Inadequate pensions for multipillar cohorts 4.5 4 3.5 Overly generous privileged pension schemes: HWV disability and survivors benefit 2.4 times higher than the old-age pension. The minimum pension granted to HWVs with less than 6 years of service was 10 percent above the average pension earned with more than 33 years of service. 3 2.5 2 1.5 1 0.5 0 Bulgaria Azerbaijan Croatia Poland Romania Hungary Kazakhstan Belarus Armenia Uzbekistan Montenegro Turkey Slovenia Ukraine Lithuania Russian Federation Latvia Czech Republic Macedonia, FYR Kyrgyz Republic Serbia Slovak Republic Albania Moldova Estonia Bosnia and Herzegovina Bosnia Republika Srpska Source: MoF, staff calculations. 21
Pension systemrecommendations Gradually raising the second pillar contribution rate. Accelerate the retirement age increase before 2030 and tighten and phase out the early retirement. Rationalize the categories of privileged pensions and accelerate convergence of privileged pensions to PAYG by equalizing the maximum privileged pension with the old-age maximum pension. Use means-testing for granting minimum pensions and award pension points only for periods with contributions paid. Revisit the pension indexation. Tighten the disability assessment procedures. 22
VI. Long-term care Basic infrastructure exists, but a comprehensive LTC plan is needed severely dependent population (at around 300,000) is growing by more than 1% annually Increase in institutional capacity for LTC provision by non-state institutions (up by 36%) with the rise in LTC employees increased by 29% in 2003-12 period Inverse dependency ratio: by 2050 there will be six potential care providers for each severely dependent person and there will be two potential taxpayers for each person of retirement age. Public spending on LTC will grow from the current 0.15% of GDP to about 1.3% of GDP in the medium variant 23
Long-term carerecommendations Develop a comprehensive LTC plan. Shift LTC services from the health to the social sector because they will be mostly social services, and cost less than health services. Favor community-based over institutional care. Decrease care fragmentation and increase coordination (health and social welfare, local and national govt and civil society). Explore a shift from the government-producing LTC services to buying them from the private sector. Target government funding through means-testing (half of beneficiaries were able to fully finance their social service costs in 2012, with a gradual decline of national state subsidies to 42%) Explore the potential of cash benefits and vouchers for funding LTC. 24
VII. Social assistance Relies on poorly targeted, categorical rather than needs-based benefits persistence of poverty and social exclusion Costly system (3.8% of GDP, using broader; 2.4% of GDP using narrower definition); well-targeted GMB accounts for less than 0.4% of GDP Low coverage and generosity of social assistance programs around 1/2 of the poorest quintile and about 27 percent of overall resources Disincentive employment effect found for family-based social assistance (27% of the NEETD population) Targeting Accuracy of Social Protection Programs, 2011 Quintiles of consumption per adult equivalent, net of each social transfer Total Overall social protection 100.0 Social insurance 100.0 Old-age pension 100.0 Disability and survivors pension 100.0 Sickness benefit incl nursing, disability 100.0 Unemployment benefit 100.0 Social assistance programs 100.0 Social assistance in cash 100.0 SA in kind (food, firewood, clothes) 100.0 Family allowances (child allowance, maternity leave, layette) Remittances and private transfers 100.0 Q1 48.2 53.2 65.0 64.7 67.3 53.6 59.2 76.7 88.5 Q2 24.7 23.5 16.7 16.4 6.5 17.8 17.6 7.8 10.9 Q3 14.3 12.9 10.3 8.8 8.8 17.8 12.4 6.6 0.0 Q4 Q5 4.3 3.9 2.7 5.2 5.6 2.7 5.3 4.0 0.0 8.4 6.6 5.4 5.0 11.8 8.1 5.5 4.9 0.6 100.0 50.6 22.1 15.5 5.8 6.0 32.3 15.5 16.9 15.9 19.4 Source: HBS. 25
Social assistancerecommendations Savings of about 0.85% of GDP could be achieved while improving targeting Introduce a single, unified set of criteria to assess eligibility for needs- based social assistance programs (through one-stop-shop). Extend means-testing to most social assistance and family programs. Introduce a parametric redesign of the child tax allowance. Implement make-work-pay benefit reforms. Strengthen oversight and inspection. Consolidate the administrative system at national and local levels. Eliminating Elite Capture in Non-Contributory Social Assistance Programs Potential savings (% of GDP) Non-contributory programs and policies Child tax allowance Child allowance Support allowance Other programs Total SA % of GDP, 2012 Elite capture % Benefits to Q4-Q5 Political difficulty 1.0 0.5 0.2 2.2 3.8 54% 12% 9% 11% 0.5 Moderate 0.1 Moderate 0.02 Small 0.23 Moderate 0.85 Source: Estimates based on HBS 2011 26
VIII. Rationalizing subsidies At 2.1% of GDP spending double compared to the EU; dominated by selective, sectoral and firm-specific state aid Railway, road and port infrastructure account for 90% of all guarantees Low and sometimes deteriorating performance indicators suggest the ineffectiveness of state aid, especially for railroads, ports, and agriculture. Transition from sector-specific to horizontal types of state aid (like R&D) Potential savings of about 1% of GDP Croatia s Total Non-Crisis State Aid and Its Structure, % of GDP Source: EUROSTAT, Croatian Competition Agency (CCA). 27
VIIIa. Railways Part of the European transport network EUR 2bn in the period 2014-20 for investments Public transfers to railways amounted to 0.6% of GDP in 2012 (half for infrastructure) 5.8% of GDP invested in railway since 2002 (15% of GDP invested in motorways) Significant decline in demand (by 36% since 2007, measured in million traffic units), poor operating performance, and an aging rolling stock (the majority of assets are more than 30 years old) Low efficiency: Labor productivity low and falling since 2008, mainly due to overstaffing Wage bill remains unsustainably high (70% of operating revenues for labor costs, compared to 40% in EU) Weak financial performance Key Performance Indicators of Railways 2005 2007 2009 2010 2011 2012* Traffic units (mill pass-km + ton-km) 4,372 5,482 4,706 4,474 4,249 3,525 Traffic intensity [traffic units/km] 1,603,778 2,013,924 1,728,876 1,643,644 1,560,985 1,295,004 Total staff 14,152 13,411 12,843 12,491 12,468 11,493 Labor productivity [traffic units/staff] 308,925 408,761 366,425 358,178 340,792 306,708 Labor cost as % of operating revenue 76.20% 64.60% 71.20% 70.60% 78.6% 71.3% Average depreciation [Eurocents] unit operating Cost less 0.084 0.066 0.077 0.078 0.081 0.113 Operating ratio with state support 1.25 1.27 1.12 1.12 1.04 1.33 Operating ratio without state support 66% 79% 72% 72% 69% 58% Source: HZ, State budget, World Bank calculations. 28
Railwaysrecommendations Subsidies could be decreased by 0.3 percent of GDP without significantly affecting the service Define an affordable level of funding for the sector, along with an overall transport investment program. Set the structure of the financial support to railways through PSC and MAIC. Adjust the level of services and the network size. Strengthen the contractual relationships of the infrastructure manager and passenger operator. Enforce the restructuring program to meet planned cost cutting targets (a 50% staff cut from 2011 levels would bring staff productivity to EU27 levels) Maximize EU Funds absorption for investments and secure national contribution (close to EUR600 million) from operational savings 29
VIIIb. Agriculture and Rural Development Farm Labor Productivity, Croatia and the EU (2005-11 average) Increase in the ARD budget over the last decade (to above 1% of GDP double w/r most EU), but low small farm productivity Good overall land productivity (due to 2/3 of agricultural area larger than 10 hectares), but a high share of subsistence- agricultural holdings weakens overall labor productivity The standard output of an average Croatian farm is still about 5 times smaller than that of the average EU15 Market interventions not fully compatible with the EU The quality and efficiency of agricultural policies significantly lower compared to other EU countries and the gap is growing Source: Eurostat. Agricultural Policy Costs Score: 1 - 7 (best) 4.5 4.0 3.5 Croatia EU13 EU15 3.0 2.5 2.0 30 Source: Global Competitiveness Index, World Economic Forum.
Agriculture and rural development recommendations Reduce spending by 0.2-0.5 percentage points of GDP to align its spending level to most other EU countries Make strategic decisions on the allocation of the sector budget between the nationally-funded expenditure categories and avoid duplicating EU- funded interventions Enforce subsidy modulation and eliminate income support (instead consider means-testing minimum pensions) Strengthen and rationalize public services in agriculture (25% of total sector spending) Ensure fiscal discipline, budget transparency, and streamlined budget planning priorities Terminate market interventions on milk, mandarins and apples Take advantage of the option to transfer Pillar 2 funds into the CNDP envelope for 2014-16 (would save 0.13% of GDP) 31
Ensuring sustainability Croatia has entered EU but its fiscal weaknesses and vulnerabilities pose substantial risks for future substantially reduce those risks, putting its public debt on a downward trajectory To achieve debt sustainability, the government will need to turn 1.8% primary deficit in 2013 into a balance by 2015 around 1.5 pp of GDP in structural deficit reduction required Simultaneously, Croatia will need to create fiscal space of 1.8% of GDP a year in 2014-20 to support EU funds absorption through the efficient utilization of EU funds, combined with substitution (where allowed) and switching of budget spending toward high return investments Croatia s spending and revenue pattern offers a sizeable scope for fiscal adjustment of 4-5 pps of GDP raise additional revenue of 2% of GDP with limited adverse impacts on growth and employment, but focus should be on the spending side 32
Can it be done? Average annual cyclically adjusted primary balance improvement, % of GDP 4.5 4.1 4.0 3.3 3.5 2.8 3.0 2.5 2.5 1.9 1.8 1.8 2.0 1.6 1.6 1.5 1.5 1.3 1.2 1.5 1.0 1.0 0.5 0.0 Source: EUROSTAT, World Bank staff calculations 33
