Retirement Planning Insights
Explore valuable insights on retirement planning, including setting goals, sources of income, investment strategies, and more. Understand the challenges faced by workers in saving for retirement and gain essential knowledge to secure a comfortable future. Take the first step towards a well-charted retirement course today.
Uploaded on | 0 Views
Download Presentation

Please find below an Image/Link to download the presentation.
The content on the website is provided AS IS for your information and personal use only. It may not be sold, licensed, or shared on other websites without obtaining consent from the author. If you encounter any issues during the download, it is possible that the publisher has removed the file from their server.
You are allowed to download the files provided on this website for personal or commercial use, subject to the condition that they are used lawfully. All files are the property of their respective owners.
The content on the website is provided AS IS for your information and personal use only. It may not be sold, licensed, or shared on other websites without obtaining consent from the author.
E N D
Presentation Transcript
Disclosure Notice The presentation (The Road to Retirement, Charted Course or Aimless Wander ) and accompanying narrative was created by the Arkansas Securities Department. It is intended solely for educational purposes and cannot be copied, distributed, or used in any manner without the permission of the Arkansas Securities Department.
Im retired goodbye tension, hello pension. Retirement: World s longest coffee break. Retirement - when you stop living at work and begin working at living. Life begins at retirement.
The question isnt at what age I want to retire but, at what income. Retirement: It s nice to get out of the rat race, but you have to learn to get along with less cheese. The retirement challenge is how to spend time without spending money. Retirement is when the living is easy and the payments are hard.
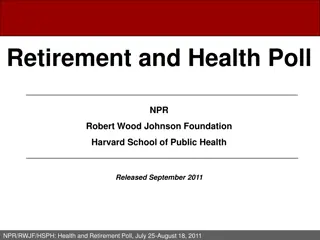
87% - Workers Not Confident About Their Retirement 57% - Workers Reporting The Value Of Their Savings & Investments Is Less Than $25,000 28% - Workers Saying They Have Less Than $1000 54% - Workers Who Haven t Tried To Calculate How Much They Will Need To Save For A Comfortable Retirement
General information on the steps required to develop a personal retirement plan, including: Establishing Basic Retirement Goals Sources of Retirement Income Retirement Income Gaps and How to Close Leveraging Your Personal Retirement Savings With Tax- Advantaged Resources Price of Procrastination Basic Investing Your Investment Profile , Products, Principles Implementing My Plan Who Do I Work With and What Should I Know? Resources You Can Use For Assistance
Establish Goals Assess Current Situation Develop Objectives and Strategies Review and Update As Required
Initial plans are designed to provide a general assessment of needs and a basic course of action to achieve them. Projections are estimates based on assumptions, which may or may not be valid over the horizon of the plan. The nearer to retirement, the more precise the plan.
My Retirement Age or Date. But, you may need to be flexible!
Food, Utilities, Clothing, Home, Auto Insurance Home, Auto, Life, Healthcare Children College and/or Support Mortgage / Credit Cards Travel & Fun Emergency Funds
100% 90% 94% 88% 80% 85% 82% 82% 80% 79% 78% 70% $20,000 $40,000 $60,000 $80,000 60% 50% 40% 30% 20% 10% 0% Single Age 65 Married Age 65/62 Assumptions: No Mortgage; No Dependent Children; Reduced Taxes; No Work-Related Expenses
$30,000 OF INCOME TODAY $1 OF PURCHASING POWER TODAY 3 80,000 72,818 2.43 70,000 2.5 60,000 54,183 1.81 2 50,000 40,317 1.34 1.5 40,000 3% 3% 30,000 1 20,000 0.5 10,000 0 0 10 20 30 10 20 30 Years Years
$30,000 OF INCOME TODAY $1 OF PURCHASING POWER TODAY 5 140,000 129,658 4.32 4.5 120,000 4 100,000 3.5 79,599 3 2.65 80,000 2.5 3% 5% 3% 5% 72,818 60,000 48,867 2.43 2 1.63 54,183 1.5 40,000 1.81 40,317 1 1.34 20,000 0.5 0 0 10 20 30 10 20 30 Years Years
Historical Inflation Rates 16 14 12 10 8 % 6 4 2 0 1962 1972 1982 1992 2002 2012
Is the Rate of Return on My Retirement Savings Staying Ahead of Inflation?
87 86 86 84.9 85 84 83.7 84 83 82.3 Male Female 82 81 81 80 79 78 Age 60 Age 65 Age 70
60% 53% 50% 41% 40% 32% Age 85 Age 90 30% 20% 20% 10% 0% Male Age 65 Female Age 65
80% 72% 70% 60% 53% 50% 45% 41% 40% Age 85 Age 90 Age 95 32% 30% 20% 18% 20% 10% 0% Male Age 65 Female Age 65 Married Couple Age 65 - One Person Living To Age
Employee Pension Social Security Personal Savings
Government program initiated in 1935 Qualifying Requires at least 40 credits; generally, 10 years in which you had earnings subject to social security taxes Benefit based on highest 35 years of earnings Benefit Ages Early Age 62 to full retirement date (penalties apply) Full Birthday 1937 and earlier Age 65 1938 to 1942 Graded, Age 65, 2 mo. to 65, 10 mo. 1943 to 1954 Age 66 1955 to 1959 Graded, Age 66, 2 mo. to 66, 10 mo. 1960 + - Age 67 Delayed Full To Age 70 (additional benefits accrue)
Social Security Benefit (2013) Average $1,261/mo. Maximum $2,533/mo. Income Limits (2013) Before full benefit date, earned income is limited to $15,120 - For every $2 earned over the limit, $1 of benefit is withheld - No limit at or after full benefit date Taxation of Benefits File Federal Taxes as: Individual - Income between $25,000 and $34,000 Pay on up to 50% Income more than $34,000 Pay on up to 85% Joint Income between $32,000 and $44,000 Pay on up to 50% Income more than $44,000 Pay on up to 85% Other Benefit Provisions: Disability Survivorship Spouse and Minor Children Disabled Adult Children
Concerns and Issues: Social Security Trust Fund is Critically Underfunded Projected to be Depleted in 2033 Medicare in 2024 Causes - Changing Demographics - Increasing Life Expectancies Lower Worker to Retiree Ratio Fixing the Problem Raise Taxes Lower Benefits Bottom Line - Significant Changes Must Occur
AVERAGE PERSONAL SAVINGS RATE HOUSEHOLD SAVINGS RATE COMPARISON (2012) 16.10% Past 10 Years = 3.61% 18.00% 16.00% 14.00% 12.10% 12.00% Range: Low = 1.86% (2005) High = 5.03% (2008) 11.00% 10.00% 8.00% 6.60% 6.00% 4.30% 4.00% 3.30% % 1.90% 2.00% 0.00% France Japan U.K. Canada Germany USA Switzerland
AVERAGE HOUSEHOLD DEBT ($96,173) AVERAGE NET WORTH BY AGE GROUP Dollars Dollars 1,475 8,525 Mortgage 5,770 51,575 7,694 < 25 25 - 34 35 - 44 45 - 54 55 - 64 > 65 6,732 Student Loans Auto Loans Credit Card Other 232,000 98,350 68,283 180,125 7,694
AVERAGE HOUSEHOLD DEBT PER INDEBTED AVERAGE NET WORTH BY AGE GROUP Dollars Dollars 1,475 8,525 51,575 15,422 < 25 25 - 34 35 - 44 45 - 54 55 - 64 > 65 Mortgage 232,000 98,350 34,703 Student Loans Credit Card 149,782 180,125
John Single - Age 45 Started With Current Employer - Age 35 Assumptions: Planned Retirement Date - Age 65 Current Annual Salary - $35,000 Has Traditional Pension Plan Inflation 3% Replacement Ratio 85% Planned Retirement Years 25 (Age 90) Savings $35,000 in Bank CD s Avg. Rate of Return 3% Not Currently Saving For Retirement
Projected Retirement Income Replacement Need: $35,000 @ 3% inflation for 20 years X 85% = $53,732 per year Sources of Retirement Income: Pension Plan Estimated $2,200 per month, or Social Security Estimated $1,140 per month, or $26,400 per year $13,680 per year $40,080 per year ($13,652) per year Personal Savings - $35,000 @ 3% for 20 Years = $63,725 Years to Deplete @ 13,652 per year with a 3% rate of return = 5.1 years 25 (years in retirement) 5.1 years (funded) = 19.9 years (income deficient) Retirement Income Gap: $13,652 X 19.9 years =
Projected Retirement Income Replacement Need: $35,000 @ 3% inflation for 20 years X 85% = $53,732 per year Sources of Retirement Income: Pension Plan Estimated $2,200 per month, or Social Security Estimated $1,140 per month, or $26,400 per year $13,680 per year $40,080 per year ($13,652) per year Personal Savings - $35,000 @ 3% for 20 Years = $63,725 Years to Deplete @ 13,652 per year with a 3% rate of return = 5.1 years 25 (years in retirement) 5.1 years (funded) = 19.9 years (income deficient) Retirement Income Gap: $13,652 X 19.9 years = $ 271,675
Save More Increase Rate of Return on Savings Adjust Retirement Date Consider Working In Retirement
What about our example situation? Gap = $271,675 Save More $381.59 (26 times per year) ($9,921.34 per year) @ 3% for 20 years = $271,676
What about our example situation? Gap = $271,675 Save More $381.59 (26 times per year) ($9,921.34 per year) @ 3% for 20 years = $271,676 Increase Rate of Return Total Savings Required = $341,300 ($13,652 X 25 years) Rate of Return = 6% on all savings (including existing $35,000 ) $35,000 + $224.50 (26 times per year) ($5,837 per year) @ 6% for 20 years = $341,306
Payroll deducted retirement savings programs 401k, 403b and 457b Tax-advantaged savings - Contributions are made with pre-tax dollars ($1 of contribution reduces paycheck by less than $1) Tax-deferred growth Gains or earnings deferred Contribution limits $17,500, plus additional $5,500 if over age 50 Some employers may make contributions or offer matches Investment options Fixed income and mutual funds Distributions 401k/403b Age 59 or, 55 & separation from service 457b separation from service In-Service Withdrawals 401k/403b Specified purposes, check w/plan 457b - Only for extreme financial hardship
What about our example situation ? Previous after-tax contribution scenario - Rate of Return = 6% on all savings (including existing $35,000) $35,000 + $224.50 (26 times per year) ($5,837 per year) @ 6% for 20 years = $341,306
What about our example situation ? Previous after-tax contribution scenario - Rate of Return = 6% on all savings (including existing $35,000) $35,000 + $224.50 (26 times per year) ($5,837 per year) @ 6% for 20 years = $341,306 Using pre-tax contributions of $224.50 = net paycheck reduction of $175.11 ($4,552.86 per year)
300,000 252,532 250,000 202,891 200,000 116,740124,607132,631140,821149,178157,700 150,000 Dollars 100,000 50,000 0 Plan Input 1 2 3 4 5 10 15 Years
Whats Your Choices? Accept retirement as is Develop a plan to adjust Be flexible on your retirement date Consider a post-retirement career Start doing something's to cushion the financial impact of less money in retirement What Can I Do? Start reducing debt Start thinking about unnecessary expenses Start saving or save more Utilize tax-advantaged programs Focus on take-home pay reductions Pay yourself first - Increase savings amount each year or with each salary increase you get
Some Questions to Consider: How do I feel about taking risk with my money? Do I understand the risk / reward relationship? How well do I tolerate fluctuations in the value of my assets? What s my time horizon? What s my investing experience?
Conservative investments/contributions objective Forced to look at higher risk/higher reward options Last Resort : Adjust Retirement Date Work In Retirement
All Investments Carry Some Level of Risk Investments With Potentially Higher Returns Are Generally Accompanied By Higher Risk Factors Diversification Investing In A Variety Of Assets To Minimize Risk Asset Allocation - Balancing Risk Versus Reward By Adjusting The Percentage Of Each Asset In An Investment Portfolio According To Goals, Risk Tolerance, And Time Horizon Successful Investing Requires Periodic Monitoring And Adjustments
Certificates of Deposit Money Market Funds Bonds Government , Corporate Stocks Preferred, Common Mutual Funds Bond, Stock, Index, Hybrid Options
Average Rate of Return - 1926 thru 2010 U.S. Small Company Stocks : +12.1% International Stocks: +10.1% U.S. Large Company Stocks: +9.9% Balanced Stock/Bond Portfolio: +8.3% Bonds: +5.5% Money Market: +3.6% Inflation : 3%
Who Should I Work With and What Should I Know? Work Only With Licensed / Registered Companies and Representatives Be Informed About Your Investments Stay In Charge of Your Money Understand The Fine Print Terms, Fees, Ability and Cost to Access Money Never Sign Anything Until You Are Completely Sure Demand Periodic Statements and Representative Reviews Be On Guard For Too Good To Be True Deals
Retirement Planning: U.S. Department of Labor Taking The Mystery Out Of Retirement Planning - www.dol.gov/ebsa/Publications/nearretirement.html Sources of Retirement Income: U.S. Social Security Administration - Benefit Calculator - www.ssa.gov/planners/calculators.htm Traditional Pension Plan See Your Employer Leveraging Retirement Savings Dollars: Tax-Advantaged Savings Programs See Your Employer Implementing My Plan: Financial Industry National Regulatory Association (FINRA) Broker Check www.finra.org/Investors/ToolsCalculators/Broker Check
Would you tell me which way I ought to go from here? asked Alice. That depends a good deal on where you want to get, said the Cat. d I really don t care where replied Alice. Then it doesn t much matter which way you go, said the Cat.
If you dont know where you re going, it doesn t matter which road you take.

