Revealing Insights on Mortgage Credit Availability Trends
Discover the latest trends and challenges in mortgage credit availability from expert analysis and data presented at the CFA Financial Services Conference. Explore the factors influencing tight credit conditions, access to credit, default rates, and the impact on different borrower segments. Gain valuable insights into the current state of lending practices in the housing market.

Download Presentation

Please find below an Image/Link to download the presentation.
The content on the website is provided AS IS for your information and personal use only. It may not be sold, licensed, or shared on other websites without obtaining consent from the author. If you encounter any issues during the download, it is possible that the publisher has removed the file from their server.
You are allowed to download the files provided on this website for personal or commercial use, subject to the condition that they are used lawfully. All files are the property of their respective owners.
The content on the website is provided AS IS for your information and personal use only. It may not be sold, licensed, or shared on other websites without obtaining consent from the author.
E N D
Presentation Transcript
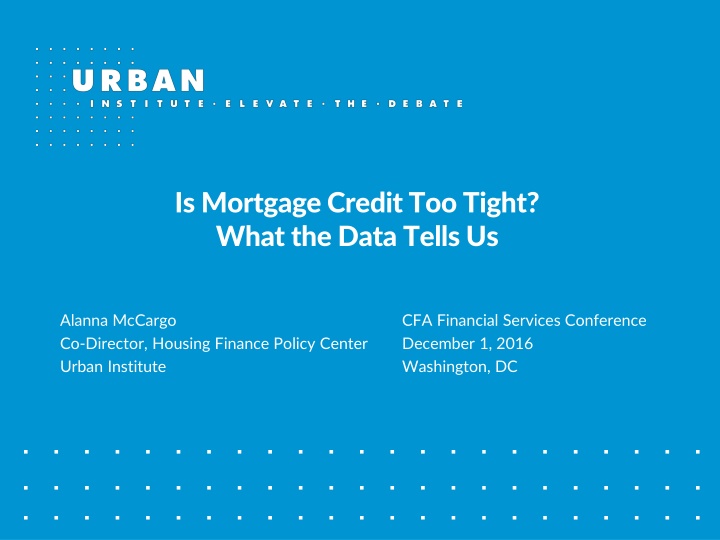
Is Mortgage Credit Too Tight? What the Data Tells Us Alanna McCargo Co-Director, Housing Finance Policy Center Urban Institute CFA Financial Services Conference December 1, 2016 Washington, DC
The Tight Credit Culprits Credit remains tight, but some progress has been made. The following are major culprits to tight credit in today s mortgage lending environment: Credit models: more higher-credit borrowers, fewer lower-credit borrowers Underwriting standards, time and cost Regulation, Litigation (False Claims) and repurchase fears Lender restrictions and overlays High cost of servicing (even in a lower default servicing environment) Continued uncertainty and lack of private participation Mortgage product mix It s time to lend again to borrowers with less-than-perfect credit. Dr. Laurie Goodman, Urban Institute 2
Access to Credit Remains Tight: Urban s Housing Credit Availability Index (HCAI) Default Risk Taken by the Mortgage Market, 1998Q1 2016Q2 Percent Total default risk 18.0 Reasonable lending standards 16.0 14.0 Product risk 12.0 10.0 8.0 6.0 Borrower risk 4.0 2.0 2016 Q2 0.0 1998 1999 2000 2001 2002 2003 2004 2005 2006 2007 2008 2009 2010 2011 2012 2013 2014 2015 2016 Sources: eMBS, Federal Housing Administration (FHA) and the Urban Institute. Note: All series measure the first-time homebuyer share of purchase loans for principal residences. 3
Todays mortgage borrowers are not defaulting - their perfection is off the charts Sources Sources: Fannie Mae Single Family Loan-Level Dataset and Urban Institute calculations 4
1.1 million missing loans in 2015 Cumulative missing loans, 2009-2015: 6.3 million 5
More high More high- -credit borrowers, fewer low credit borrowers, fewer low- -credit borrowers credit borrowers 6
First-Time Homebuyer Characteristics GSEs FHA GSEs and FHA 90% 82.0% 80% 70% 56.3% 60% 50% 42.7% 40% 30% 20% 2001 2002 2003 2004 2005 2006 2007 2008 2009 2010 2011 2012 2013 2014 2015 2016 Sources: eMBS, Federal Housing Administration (FHA ) and Urban Institute. Note: All series measure the first-time homebuyer share of purchase loans for principal residences. GSEs FHA GSEs and FHA First-time Repeat First-time Repeat First-time Repeat Characteristics Loan Amount ($) 226,091 249,867 195,264 217,553 211,367 243,524 Credit Score 741.4 755.3 680.07 687.88 712.13 742.07 LTV (%) 86.43 79.52 95.6 94.41 90.42 82.04 DTI (%) 33.51 34.22 40.92 41.77 37.05 35.7 Loan Rate (%) 3.69 3.59 3.69 3.61 3.69 3.59 Sources: eMBS and Urban Institute. Note: Based on owner-occupied purchase mortgages originated in August 2016. 7
Borrower Race, Ethnicity, and Income: Origination HMDA data shows stagnant or worse performance for loans in lower to medium income tiers and less lending overall in the past 10 years to minority groups. 2004 2006 2009 2012 2013 2014 2015 Borrower race/ethnicity Black Hispanic Non-Hispanic White Asian 6% 10% 58% 5% 9% 13% 61% 4% 4% 6% 74% 5% 4% 6% 73% 6% 4% 7% 71% 6% 5% 8% 69% 6% 5% 9% 68% 6% Borrower income Low Moderate Low Medium Moderate High High Total Originations 12% 18% 21% 24% 25% 10% 17% 21% 25% 28% 9% 16% 20% 26% 29% 10% 14% 18% 25% 33% 10% 15% 18% 25% 33% 11% 16% 19% 24% 31% 10% 15% 19% 25% 31% 15,028,550 13,970,183 8,950,936 9,783,966 8,706,657 6,039,826 7,404,258 Sources: HMDA; Urban Institute Calculations 8
Originations by Channel & Product Type (Share, percent) 100% 33.8% 90% 80% 70% 0.44% Channel Mix 60% 50% 22.8% 40% 30% 43.0% 20% 10% 0% 2001 2002 2003 2004 2005 2006 2007 2008 2009 2010 2011 2012 2013 2014 2015 2016 Q1-2 Sources: Inside Mortgage Finance and Urban Institute. Product Mix 9