Revenue Limits for School Financial Management
Explore the intricacies of revenue limits in school financial management, including calculations, exemptions, and what falls within or outside the limits. Gain insights into controlling school district revenues and managing funds effectively.
Download Presentation

Please find below an Image/Link to download the presentation.
The content on the website is provided AS IS for your information and personal use only. It may not be sold, licensed, or shared on other websites without obtaining consent from the author. If you encounter any issues during the download, it is possible that the publisher has removed the file from their server.
You are allowed to download the files provided on this website for personal or commercial use, subject to the condition that they are used lawfully. All files are the property of their respective owners.
The content on the website is provided AS IS for your information and personal use only. It may not be sold, licensed, or shared on other websites without obtaining consent from the author.
E N D
Presentation Transcript
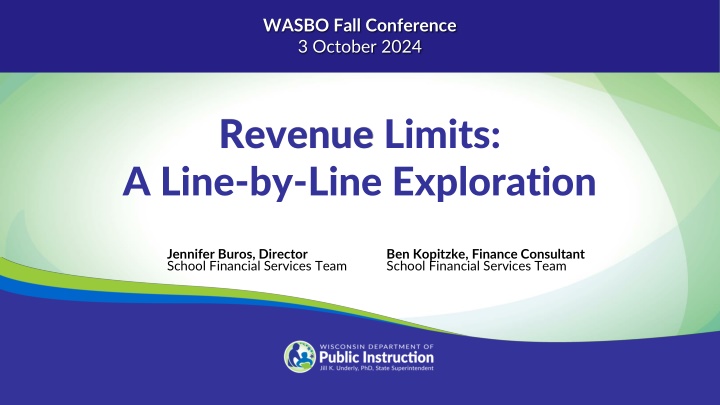
WASBO Fall Conference 3 October 2024 Revenue Limits: A Line-by-Line Exploration Jennifer Buros, Director School Financial Services Team Ben Kopitzke, Finance Consultant School Financial Services Team
Agenda Overview Calculation steps Exemptions Over/underlevy Timeline Questions 2/28
Revenue Limits, School Aids, and Property Tax Levies State Aid (General + High Poverty + Computer + Exempt Personal Property) Revenue Limit Property TaxLevy 3/28
State Totals - School District Revenues CONTROLLED Although the mix of aid and taxes is different across districts, the Revenue Limit can control 70-90% of the General Fund budget! Other Sources* 22% State General Aids^ 37% Local Property Taxes 41% ^ State General Aids includes: equalization aid, special adjustment aid, inter-district & intra-district aids, and high poverty aid (i.e., state aids received under the districts revenue limit caps). * Other Sources include: state categorical aids, federal aid, and non-property tax local revenue (i.e., revenue received outside of the districts revenue limit caps). 4/28
What is within Revenue Limits? Regulates Revenues for Funds 10, 38 and 41 General Fund (10) Property Tax Levy General State Aid Computer Aid Non-Referendum Debt Service Fund (38) Property Tax Levy Capital Projects Fund (41) Property Tax Levy 5/28
What is outside the Revenue Limit? Categorical Aids (Special Education, Per Pupil Aid, Library, Transportation, AGR, Sparsity, etc.) State and Federal Grants Student Fees, Gate Receipts, and Donations Tax Levy for Referendum Approved Debt Service Fund (39) Tax Levy for Community Service Fund (80) 6/28
DISTRICT: 2024-25 Revenue Limit Worksheet 1. 2024-25 Base Revenue (Funds 10, 38, 41) 2. Base Sept Membership Avg (2021+.4ss, 2022+.4ss, 2023+.4ss)/3 104,558,048 3. 2024-25 Base Revenue Per Member (Ln 1 / Ln2) 0 4. 2024-25 Per Member Change (A+B) 663,541 464,288 A. Allowed Per-Member Change for 2024-25 60,286,400 B. Low Rev Incr ((Low Rev Ceiling-(3+4A))-4C) NOT<0 0 C. Value of the CCDEB (2024-25 DPI Computed-CCDEB Dists only) 2,460,000 5. 2024-25 Maximum Revenue / Member (Ln 3 + Ln 4) 0 6. Current Membership Avg (2022+.4ss, 2023+.4ss, 2024+.4ss)/3 8,053,171 7. 2024-25 Rev Limit, No Exemptions (Ln7A + Ln 7B) 160,379,106 A. Max Rev/Memb x Cur Memb Avg (Ln 5 x Ln 6) B. Hold Harmless Non-Recurring Exemption 8. Total 2024-25 Recurring Exemptions (A+B+C+D+E) A. Prior Year Carryover B. Transfer of Service C. Transfer of Territory/Other Reorg (if negative, include sign) D. Federal Impact Aid Loss (2022-23 to 2023-24) E. Recurring Referenda to Exceed (If 2024-25 is first year) 9. 2024-25 Limit with Recurring Exemptions (Ln 7 + Ln 8) 10. Total 2024-25 Non-Recurring Exemptions (A+B+C+D+E+F+G+H+I) 14,063 A. Non-Recurring Referenda to Exceed 2024-25 Limit B. Declining Enrollment Exemption for 2024-25 (from left) C. Energy Efficiency Net Exemption for 2024-25 (see pg 4 for details) D. Adjustment for Refunded or Rescinded Taxes, 2024-25 E. Prior Year Open Enrollment (uncounted pupil[s]) F. Reduction for Ineligible Fund 80 Expenditures (enter as negative) G. Other Adjustments (Fund 39 Bal Transfer) H. WPCP and RPCP Private School Voucher Aid Deduction I. SNSP Private School Voucher Aid Deduction 11. 2024-25 Revenue Limit With All Exemptions (Ln 9 + Ln 10) 0 12. Total Aid to be Used in Computation (12A + 12B + 12C + 12D) A. 2024-25 JULY 1 ESTIMATE OF GENERAL AID B. State Aid to High Poverty Districts ($0 per 2023 Act 19) C. State Aid for Exempt Computers (Source 691) D. State Aid for Exempt Personal Property (Source 691) average used for Per Pupil Aid does not include "New ICS - Independent Charter Schools FTE." The PPA average appears below after data is entered for 2024: (from left) (from left) (with cents) 160,379,106 14,063 11,404.33 325.00 DATA AS OF 10/02/24 Line 1 Amount May Not Exceed (Line 11 - (Line 7B+Line 10)) of Final 23-24 Revenue Limit 2023-24 General Aid Certification (23-24 Line 12A, src 621) 2023-24 Hi Pov Aid (23-24 Line 12B, Src 628) 2023-24 Computer Aid Received (23-24 Line 12C, Src 691) 2023-24 Aid for Exempt Personal Property (23-24 Line 12D, Src 691) 2023-24 Fnd 10 Levy Cert (23-24 Line 14A, Levy 10 Src 211) 2023-24 Fnd 38 Levy Cert (23-24 Line 14B, Levy 38 Src 211) 2023-24 Fnd 41 Levy Cert (23-24 Line 14C, Levy 41 Src 211) 2023-24 Aid Penalty for Over Levy (23-24 FINAL Rev Lim, June 2024) 2023-24 Total Levy for All Levied Non-Recurring Exemptions* NET 2024-25 Base Revenue Built from 2023-24 Data (Line 1) + + + + + + + - - = 2024-25 Low Revenue Ceiling per s.121.905(1): 11,000.00 325.00 0.00 0.00 11,729.33 (from left) (rounded) 0 160,379,106 0 160,379,106 (rounded) *For the Non-Recurring Exemptions Levy Amount, enter actual amount for which district levied; (7B Hold Harmless, Non- Recurring Referenda, Declining Enrollment, Energy Efficiency Exemption, Refunded/Rescinded Taxes, Prior Year Open Enrollment Pupils, Reduction for Ineligible Fund 80 Expends, Other Adjustments, Private School Voucher Aid Deduction, Private School Special Needs Voucher Aid Deduction) 0 0 0 0 0 0 September & Summer FTE Membership Averages Count Ch. 220 Inter-District Resident Transfer Pupils @ 75%. 160,379,106 167,333 0 0 0 Line 2: Base Avg:((21+.4ss)+(22+.4ss)+(23+.4ss)) / 3 = 2021 336 134 13,962 0.00 2022 330 132 13,898 0.00 2023 324 130 13,932 0.00 Summer FTE: % (40,40,40) Sept FTE: New ICS - Independent Charter Schools FTE 22,407 144,926 0 0 0 0 Total FTE 14,096 14,030 14,062 160,546,439 12,921,373 Line 6: Curr Avg:((22+.4ss)+(23+.4ss)+(24+.4ss)) / 3 = 12,901,282 2022 330 132 13,898 0.00 2023 324 130 13,932 0.00 2024 317 127 Summer FTE: % (40,40,40) Sept FTE: New ICS - Independent Charter Schools FTE 0 The Line 6 "Current Average" shown above is used for Revenue Limits. The 20,091 0 0 0.00 DISTRICTS MUST USE THE OCT 15 AID CERT WHEN SETTING THE DISTRICT LEVY. 13. Allowable Limited Revenue: (Line 11 - Line 12) (10, 38, 41 Levies) 14. Total Limited Revenue To Be Used (A+B+C) Entries Required Below: Enter amnts needed by purpose and fund: A. Gen Operations: Fnd 10 Src 211 B. Non-Referendum Debt (inside limit) Fund 38 Src 211 C. Capital Exp, Annual Meeting Approved: Fund 41 Src 211 15. Total Revenue from Other Levies (A+B+C+D) A. Referendum Approved Debt (Fund 39 Debt-Src 211) B. Community Services (Fund 80 Src 211) C. Prior Year Levy Chargeback for Uncollectible Taxes (Src 212) D. Other Levy Revenue - Milwaukee & Kenosha Only 12,434,835,239 16. Total Fall 2024 REPORTED All Fund Tax Levy (14A + 14B + 14C + 15) Line 16 is the total levy to be apportioned in the PI-401. District-Entered Districts are responsible for the integrity of their revenue limit data & computation. Data appearing here reflects information submitted to DPI and is unaudited. 147,625,066 Total FTE 14,030 14,062 127 Not >line 13 0 9,406 0 (Proposed Fund 10) 0 (to Budget Rpt) 0 (to Budget Rpt) Line 10B: Declining Enrollment Exemption = Average FTE Loss (Line 2 - Line 6, if > 0) 0 0 X 1.00 = 0 0 0 0 X (Line 5, Maximum 2024-25 Revenue per Memb) = Non-Recurring Exemption Amount: 0 (to Budget Rpt) (to Budget Rpt) (to Budget Rpt) Fall 2024 Property Values 2024 TIF-Out Tax Apportionment Equalized Valuation 0 Levy Rate = 0.00000000 CELL COLOR KEY: Auto-Calc DPI Data 7/28 Worksheet is available at: http://dpi.wi.gov/sfs/limits/worksheets/revenue
DISTRICT: 2023-2024 Revenue Limit Worksheet 1. 2023-24 Base Revenue (Funds 10, 38, 41) 2. Base Sept Membership Avg (2020+.4ss, 2021+.4ss, 2022+.4ss)/3 98,423,124 3. 2023-24 Base Revenue Per Member (Ln 1 / Ln2) 0 4. 2023-24 Per Member Change (A+B) 663,541 464,288 A. Allowed Per-Member Change for 23-24 54,283,224 B. Low Rev Incr ((Low Rev Ceiling-(3+4A))-4C) NOT<0 0 C. Value of the CCDEB (23-24 DPI Computed-CCDEB Dists only) 2,460,000 5. 2023-24 Maximum Revenue / Member (Ln 3 + Ln 4) 0 6. Current Membership Avg (2021+.4ss, 2022+.4ss, 2023+.4ss)/3 11,423,267 7. 2023-24 Rev Limit, No Exemptions (Ln7A + Ln 7B) 144,870,910 A. Max Rev/Memb x Cur Memb Avg (Ln 5 x Ln 6) B. Hold Harmless Non-Recurring Exemption 8. Total 2023-24 Recurring Exemptions (A+B+C+D+E) A. Prior Year Carryover B. Transfer of Service C. Transfer of Territory/Other Reorg (if negative, include sign) D. Federal Impact Aid Loss (2021-22 to 2022-23) E. Recurring Referenda to Exceed (If 2023-24 is first year) 9. 2023-24 Limit with Recurring Exemptions (Ln 7 + Ln 8) 10. Total 2023-24 Non-Recurring Exemptions (A+B+C+D+E+F+G+H+I) 14,105 A. Non-Recurring Referenda to Exceed 2023-24 Limit B. Declining Enrollment Exemption for 2023-24 (from left) C. Energy Efficiency Net Exemption for 2023-24 (see pg 4 for details) D. Adjustment for Refunded or Rescinded Taxes, 2023-24 E. Prior Year Open Enrollment (uncounted pupil[s]) F. Reduction for Ineligible Fund 80 Expenditures (enter as negative) G. Other Adjustments (Fund 39 Bal Transfer) H. WPCP and RPCP Private School Voucher Aid Deduction I. SNSP Private School Voucher Aid Deduction 11. 2023-24 Revenue Limit With All Exemptions (Ln 9 + Ln 10) 14,062 12. Total Aid to be Used in Computation (12A + 12B + 12C + 12D) A. 2023-24 OCT 15 CERT OF GENERAL AID B. State Aid to High Poverty Districts ($0 per 2023 Act 19) C. State Aid for Exempt Computers (Source 691) D. State Aid for Exempt Personal Property (Source 691) average used for Per Pupil Aid does not include "New ICS - Independent Charter Schools FTE." The PPA average appears below after data is entered for 2023: (from left) (from left) (with cents) 144,870,910 14,105 10,270.89 729.11 DATA AS OF 10/16/2023 4:45 PM Line 1 Amount May Not Exceed (Line 11 - (Line 7B+Line 10)) of Final 22-23 Revenue Limit 2022-23 General Aid Certification (22-23 Line 12A, src 621) 2022-23 Hi Pov Aid (22-23 Line 12B, Src 628) 2022-23 Computer Aid Received (22-23 Line 12C, Src 691) 2022-23 Aid for Exempt Personal Property (22-23 Line 12D, Src 691) 2022-23 Fnd 10 Levy Cert (22-23 Line 14A, Levy 10 Src 211) 2022-23 Fnd 38 Levy Cert (22-23 Line 14B, Levy 38 Src 211) 2022-23 Fnd 41 Levy Cert (22-23 Line 14C, Levy 41 Src 211) 2022-23 Aid Penalty for Over Levy (22-23 FINAL Rev Lim, June 2023) 2022-23 Total Levy for All Levied Non-Recurring Exemptions* NET 2023-24 Base Revenue Built from 2022-23 Data (Line 1) + + + + + + + - - = 2023-24 Low Revenue Ceiling per s.121.905(1): 11,000.00 325.00 404.11 0.00 11,000.00 14,062 154,682,000 (from left) (rounded) 154,682,000 0 *For the Non-Recurring Exemptions Levy Amount, enter actual amount for which district levied; (7B Hold Harmless, Non- Recurring Referenda, Declining Enrollment, Energy Efficiency Exemption, Refunded/Rescinded Taxes, Prior Year Open Enrollment Pupils, Reduction for Ineligible Fund 80 Expends, Other Adjustments, Private School Voucher Aid Deduction, Private School Special Needs Voucher Aid Deduction) (rounded) 5,686,106 0 686,106 0 0 5,000,000 September & Summer FTE Membership Averages Count Ch. 220 Inter-District Resident Transfer Pupils @ 75%. 160,368,106 8,064,171 0 Line 2: Base Avg:((20+.4ss)+(21+.4ss)+(22+.4ss)) / 3 = 473,000 2020 101 40 14,150 0.00 2021 336 134 13,962 0.00 2022 330 132 13,898 0.00 Summer FTE: % (40,40,40) Sept FTE: New ICS - Independent Charter Schools FTE 0 8,742 121,322 0 0 Total FTE 14,190 14,096 14,030 6,564,100 897,007 168,432,277 105,685,877 Line 6: Curr Avg:((21+.4ss)+(22+.4ss)+(23+.4ss)) / 3 = 104,558,048 2021 336 134 13,962 0.00 2022 330 132 13,898 0.00 2023 324 130 13,931 0.00 Summer FTE: % (40,40,40) Sept FTE: New ICS - Independent Charter Schools FTE 0 The Line 6 "Current Average" shown above is used for Revenue Limits. The 663,541 464,288 DISTRICTS MUST USE THE OCT 15 AID CERT WHEN SETTING THE DISTRICT LEVY. 13. Allowable Limited Revenue: (Line 11 - Line 12) (10, 38, 41 Levies) 14. Total Limited Revenue To Be Used (A+B+C) Entries Required Below: Enter amnts needed by purpose and fund: A. Gen Operations: Fnd 10 Src 211 B. Non-Referendum Debt (inside limit) Fund 38 Src 211 C. Capital Exp, Annual Meeting Approved: Fund 41 Src 211 43 15. Total Revenue from Other Levies (A+B+C+D) 11,000.00 A. Referendum Apprvd Debt (Fund 39 Debt-Src 211) 473,000 B. Community Services (Fund 80 Src 211) C. Prior Year Levy Chargeback for Uncollectible Taxes (Src 212) D. Other Levy Revenue - Milwaukee & Kenosha Only 11,972,391,961 16. Total Fall, 2023 REPORTED All Fund Tax Levy (14A + 14B + 14C + 15) Line 16 is the total levy to be apportioned in the PI-401. District-Entered Districts are responsible for the integrity of their revenue limit data & computation. Data appearing here reflects information submitted to DPI and is unaudited. 62,746,400 Total FTE 14,096 14,030 14,061 Not >line 13 56,743,224 14,062 54,283,224 (Proposed Fund 10) 0 (to Budget Rpt) 2,460,000 (to Budget Rpt) Line 10B: Declining Enrollment Exemption = Average FTE Loss (Line 2 - Line 6, if > 0) 473,000 43 17,747,392 X 1.00 = 15,132,252 2,615,140 X (Line 5, Maximum 2023-2024 Revenue per Memb) = Non-Recurring Exemption Amount: (to Budget Rpt) (to Budget Rpt) (to Budget Rpt) 74,490,616 0.00622187 0 0 Fall 2023 Property Values 2023 TIF-Out Tax Apportionment Equalized Valuation Levy Rate = CELL COLOR KEY: Worksheet is available at: http://dpi.wi.gov/sfs/limits/worksheets/revenue Auto-Calc DPI Data 8/28 Calculation Revised: 8/5/2020. Rounding in Total FTE buckets.
Revenue Limits Membership September Pupil Count FTE + 40% Summer School FTE + New ICS FTE (3YRA) Four-Step Process Step 1: Build the Base Revenue Per Member (Worksheet lines 1-3) Step 2: Calculate New Revenue Per Member (Worksheet lines 4-7) Step 3: Determine Allowable Exemptions (Worksheet lines 8-11) Step 4: Determine Levy (Worksheet lines 13-16) The revenue limit does not include all revenues and it is not a spending limit. 9/40
Line 1: Base Revenue FINAL DATA AS OF 6/25/24 Line 1 Amount May Not Exceed (Line 11 - (Line 7B+Line 10)) of Final 22-23 Revenue Limit 2022-23 General Aid Certification (22-23 Line 12A, src 621) 2022-23 Hi Pov Aid (22-23 Line 12B, Src 628) 2022-23 Computer Aid Received (22-23 Line 12C, Src 691) 2022-23 Aid for Exempt Personal Property (22-23 Line 12D, Src 691) 2022-23 Fnd 10 Levy Cert (22-23 Line 14A, Levy 10 Src 211) 2022-23 Fnd 38 Levy Cert (22-23 Line 14B, Levy 38 Src 211) 2022-23 Fnd 41 Levy Cert (22-23 Line 14C, Levy 41 Src 211) 2022-23 Aid Penalty for Over Levy (22-23 FINAL Rev Lim, June 2023) 2022-23 Total Levy for All Levied Non-Recurring Exemptions* NET 2023-24 Base Revenue Built from 2022-23 Data (Line 1) + + + + + + + - - = 98,423,124 0 663,541 464,288 54,283,224 0 2,460,000 0 11,423,267 144,870,910 Base filled in from prior year data, found on next slide 10/2
DISTRICT: 2022-2023 Revenue Limit Worksheet 1. 2022-23 Base Revenue (Funds 10, 38, 41) 2. Base Sept Membership Avg (2019+.4ss, 2020+.4ss, 2021+.4ss)/3 94,770,375 3. 2022-23 Base Revenue Per Member (Ln 1 / Ln 2) 0 4. 2022-23 Per Member Change (A+B) 663,148 2022-23 Low Revenue Ceiling per s.121.905(1): 463,825 A. Allowed Per-Member Change for 22-23 59,279,569 B. Low Rev Incr ((Low Rev Ceiling-(3+4A))-4C) NOT<0 849,542 C. Value of the CCDEB (22-23 DPI Computed-CCDEB Dists only) 2,460,000 5. 2022-23 Maximum Revenue / Member (Ln 3 + Ln 4) 0 6. Current Membership Avg (2020+.4ss, 2021+.4ss, 2022+.4ss)/3 11,001,189 7. 2022-23 Rev Limit, No Exemptions (Ln 7A + Ln 7B) 147,485,270 A. Max Rev/Memb x Cur Memb Avg (Ln 5 x Ln 6) B. Hold Harmless Non-Recurring Exemption 8. Total 2022-23 Recurring Exemptions (A+B+C+D+E) A. Prior Year Carryover B. Transfer of Service C. Transfer of Territory/Other Reorg (if negative, include sign) D. Federal Impact Aid Loss (2020-21 to 2021-22) E. Recurring Referenda to Exceed (If 2022-23 is first year) 9. 2022-23 Limit with Recurring Exemptions (Ln 7 + Ln 8) 10. Total 2022-23 Non-Recurring Exemptions (A+B+C+D+E+F+G+H+I) 14,381 A. Non-Recurring Referenda to Exceed 2022-23 Limit B. Declining Enrollment Exemption for 2022-23 (from left) C. Energy Efficiency Net Exemption for 2022-23 (see pg 4 for details) D. Adjustment for Refunded or Rescinded Taxes, 2022-23 E. Prior Year Open Enrollment (uncounted pupil[s]) F. Reduction for Ineligible Fund 80 Expenditures (enter as negative) G. Other Adjustments (Fund 39 Bal Transfer) H. WPCP and RPCP Private School Voucher Aid Deduction I. SNSP Private School Voucher Aid Deduction 11. 2022-23 Revenue Limit With All Exemptions (Ln 9 + Ln 10) 14,105 12. Total Aid to be Used in Computation (12A + 12B + 12C + 12D) A. 2022-23 OCT 15 CERT OF GENERAL AID B. State Aid to High Poverty Districts (not all districts) C. State Aid for Exempt Computers (Source 691) D. State Aid for Exempt Personal Property (Source 691) average used for Per Pupil Aid does not include "New ICS - Independent Charter Schools FTE." The PPA average appears below after data is entered for 2022: Line 14 > Line 13 (from left) (from left) (with cents) 147,485,270 14,381 10,255.56 FINAL DATA AS OF 6/6/2023 4:30 PM Line 1 Amount May Not Exceed (Line 11 - (Line 7B+Line 10)) of Final 21-22 Revenue Limit 2021-22 General Aid Certification (21-22 Line 12A, src 621) 2021-22 Hi Pov Aid (21-22 Line 12B, Src 628) 2021-22 Computer Aid Received (21-22 Line 12C, Src 691) 2021-22 Aid for Exempt Personal Property (21-22 Line 12D, Src 691) 2021-22 Fnd 10 Levy Cert (21-22 Line 14A, Levy 10 Src 211) 2021-22 Fnd 38 Levy Cert (21-22 Line 14B, Levy 38 Src 211) 2021-22 Fnd 41 Levy Cert (21-22 Line 14C, Levy 41 Src 211) 2021-22 Aid Penalty for Over Levy (21-22 FINAL Rev Lim, June 2022) 2021-22 Total Levy for All Levied Non-Recurring Exemptions* NET 2022-23 Base Revenue Built from 2021-22 Data (Line 1) + + + + + + + - - = 0.00 10,000.00 0.00 0.00 0.00 10,255.56 14,105 147,485,270 (from left) (rounded) 144,654,674 2,830,596 (rounded) *For the Non-Recurring Exemptions Levy Amount, enter actual amount for which district levied; (7B Hold Harmless, Non- Recurring Referenda, Declining Enrollment, Energy Efficiency Exemption, Refunded/Rescinded Taxes, Prior Year Open Enrollment Pupils, Reduction for Ineligible Fund 80 Expends, Other Adjustments, Private School Voucher Aid Deduction, Private School Special Needs Voucher Aid Deduction) 216,236 0 216,236 0 0 0 September & Summer FTE Membership Averages Count Ch. 220 Inter-District Resident Transfer Pupils @ 75%. 147,701,506 8,602,927 Line 2: Base Avg:((19+.4ss)+(20+.4ss)+(21+.4ss)) / 3 = 0 Final 2022-23 RLW 2,830,535 2019 405 162 14,695 0.00 2020 101 40 14,150 0.00 2021 336 134 13,962 0.00 Summer FTE: % (40,40,40) Sept FTE: New ICS - Independent Charter Schools FTE 0 39,426 120,631 0 0 Total FTE 14,857 14,190 14,096 4,821,855 790,480 156,304,433 99,550,953 Line 6: Curr Avg:((20+.4ss)+(21+.4ss)+(22+.4ss)) / 3 = 98,423,124 2020 101 40 14,150 0.00 2021 336 134 13,962 0.00 2022 330 132 13,898 0.00 Summer FTE: % (40,40,40) Sept FTE: New ICS - Independent Charter Schools FTE 0 The Line 6 "Current Average" shown above is used for Revenue Limits. The Overlevy if 663,541 464,288 DISTRICTS MUST USE THE OCT 15 AID CERT WHEN SETTING THE DISTRICT LEVY. 13. Allowable Limited Revenue: (Line 11 - Line 12) (10, 38, 41 Levies) 14. Total Limited Revenue To Be Used (A+B+C) Entries Required Below: Enter amnts needed by purpose and fund: A. Gen Operations: Fnd 10 Src 211 B. Non-Referendum Debt (inside limit) Fund 38 Src 211 C. Capital Exp, Annual Meeting Approved: Fund 41 Src 211 276 15. Total Revenue from Other Levies (A+B+C+D) 10,255.56 A. Referendum Apprvd Debt (Fund 39 Debt-Src 211) 2,830,535 B. Community Services (Fund 80 Src 211) C. Prior Year Levy Chargeback for Uncollectible Taxes (Src 212) D. Other Levy Revenue - Milwaukee & Kenosha Only 10,491,604,760 16. Total Fall, 2022 REPORTED All Fund Tax Levy (14A + 14B + 14C + 15) Line 16 is the total levy to be apportioned in the PI-401. District-Entered Districts are responsible for the integrity of their revenue limit data & computation. Data appearing here reflects information submitted to DPI and is unaudited. 56,753,480 Total FTE 14,190 14,096 14,030 Not >line 13 56,743,224 14,105 54,283,224 (Proposed Fund 10) 0 (to Budget Rpt) 2,460,000 (to Budget Rpt) Line 10B: Declining Enrollment Exemption = Average FTE Loss (Line 2 - Line 6, if > 0) 2,830,535 276 X 1.00 17,747,392 = 15,132,252 2,615,140 X (Line 5, Maximum 2022-2023 Revenue per Memb) = Non-Recurring Exemption Amount: (to Budget Rpt) (to Budget Rpt) (to Budget Rpt) 74,490,616 0.00710002 0 0 Fall 2022 Property Values 2022 TIF-Out Tax Apportionment Equalized Valuation Levy Rate = CELL COLOR KEY: Worksheet is available at: http://dpi.wi.gov/sfs/limits/worksheets/revenue Auto-Calc DPI Data 11/2 Calculation Revised: 8/5/2020. Rounding in Total FTE buckets.
Lines 2 & 6 and Per Pupil Aid September & Summer FTE Membership Averages September & Summer FTE Membership Averages Count Ch. 220 Inter-District Resident Transfer Pupils @ 75%. Count Ch. 220 Inter-District Resident Transfer Pupils @ 75%. Line 2: Base Avg:((20+.4ss)+(21+.4ss)+(22+.4ss)) / 3 = Line 2: Base Avg:((20+.4ss)+(21+.4ss)+(22+.4ss)) / 3 = 14,105 26,330 2020 208 83 26,188 2021 412 165 25,678 2022 338 135 25,547 2020 101 40 14,150 0.00 299.20 2021 336 134 13,962 0.00 345.40 2022 330 132 13,898 0.00 551.00 Summer FTE: % (40,40,40) Sept FTE: New ICS - Independent Charter Schools FTE Summer FTE: % (40,40,40) Sept FTE: New ICS - Independent Charter Schools FTE Total FTE Madison 14,190 26,570 14,096 26,188 14,030 26,233 Total FTE Line 6: Curr Avg:((21+.4ss)+(22+.4ss)+(23+.4ss)) / 3 = Line 6: Curr Avg:((21+.4ss)+(22+.4ss)+(23+.4ss)) / 3 = 14,063 26,204 2021 412 165 25,678 2022 338 135 25,547 2023 300 120 25,565 2021 336 134 13,962 0.00 345.40 2022 330 132 13,898 0.00 551.00 2023 324 130 13,932 0.00 504.60 Summer FTE: % (40,40,40) Sept FTE: New ICS - Independent Charter Schools FTE Summer FTE: % (40,40,40) Sept FTE: New ICS - Independent Charter Schools FTE Total FTE The Line 6 "Current Average" shown above is used for Revenue Limits. The average used for Per Pupil Aid does not include "New ICS - Independent Charter Schools FTE." The PPA average appears The Line 6 "Current Average" shown above is used for Revenue Limits. The average used for Per Pupil Aid does not include "New ICS - Independent Charter Schools FTE." The PPA average appears below after data is entered for 2023: below after data is entered for 2023: 14,096 26,188 14,030 26,233 14,062 26,190 Total FTE 14,063 25,737 12/2
Line 10B: Declining Enrollment Exemption Line 10B: Declining Enrollment Exemption = Average FTE Loss (Line 2 - Line 6, if > 0) 462,000 42 42 X 1.00 = 11,000.00 462,000 X (Line 5, Maximum 2023-2024 Revenue per Memb) = Non-Recurring Exemption Amount: 10. Total 2023-24 Non-Recurring Exemptions (A+B+C+D+E+F+G+H+I) A. Non-Recurring Referenda to Exceed 2023-24 Limit B. Declining Enrollment Exemption for 2023-24 (from left) C. Energy Efficiency Net Exemption for 2023-24 (see pg 4 for details) D. Adjustment for Refunded or Rescinded Taxes, 2023-24 E. Prior Year Open Enrollment (uncounted pupil[s]) F. Reduction for Ineligible Fund 80 Expenditures (enter as negative) G. Other Adjustments (Fund 39 Bal Transfer) H. WPCP and RPCP Private School Voucher Aid Deduction I. SNSP Private School Voucher Aid Deduction 8,053,171 0 462,000 0 8,742 121,322 0 0 6,564,100 897,007 13/2
Build the Base Revenue Per Member 1. 2023-24 Base Revenue (Funds 10, 38, 41) 2. Base Sept Membership Avg (2020+.4ss, 2021+.4ss, 2022+.4ss)/3 3. 2023-24 Base Revenue Per Member (Ln 1 / Ln 2) (from left) (from left) (with cents) 144,870,910 14,105 10,270.89 FINAL DATA AS OF 6/25/24 Line 1 Amount May Not Exceed (Line 11 - (Line 7B+Line 10)) of Final 22-23 Revenue Limit 2022-23 General Aid Certification (22-23 Line 12A, src 621) 2022-23 Hi Pov Aid (22-23 Line 12B, Src 628) 2022-23 Computer Aid Received (22-23 Line 12C, Src 691) 2022-23 Aid for Exempt Personal Property (22-23 Line 12D, Src 691) 2022-23 Fnd 10 Levy Cert (22-23 Line 14A, Levy 10 Src 211) 2022-23 Fnd 38 Levy Cert (22-23 Line 14B, Levy 38 Src 211) 2022-23 Fnd 41 Levy Cert (22-23 Line 14C, Levy 41 Src 211) 2022-23 Aid Penalty for Over Levy (22-23 FINAL Rev Lim, June 2023) 2022-23 Total Levy for All Levied Non-Recurring Exemptions* NET 2023-24 Base Revenue Built from 2022-23 Data (Line 1) + + + + + + + - - = 98,423,124 0 663,541 464,288 54,283,224 0 2,460,000 0 11,423,267 144,870,910 September & Summer FTE Membership Averages Count Ch. 220 Inter-District Resident Transfer Pupils @ 75%. Line 2: Base Avg:((20+.4ss)+(21+.4ss)+(22+.4ss)) / 3 = 14,105 2020 101 40 14,150 0.00 2021 336 134 13,962 0.00 2022 330 132 13,898 0.00 Summer FTE: % (40,40,40) Sept FTE: New ICS - Independent Charter Schools FTE Total FTE 14,190 14,096 14,030 14/2
Calculate New Revenue Per Member 3. 2023-24 Base Revenue Per Member (Ln 1 / Ln 2) 4. 2023-24 Per Member Change (A+B) (with cents) 10,270.89 729.11 2023-24 Low Revenue Ceiling per s.121.905(1): 11,000.00 325.00 404.11 A. Allowed Per-Member Change for 23-24 B. Low Rev Incr ((Low Rev Ceiling-(3+4A))-4C) NOT<0 C. Value of the CCDEB (23-24 DPI Computed-CCDEB Dists only) 5. 2023-24 Maximum Revenue / Member (Ln 3 + Ln 4) 6. Current Membership Avg (2021+.4ss, 2022+.4ss, 2023+.4ss)/3 7. 2023-24 Rev Limit, No Exemptions (Ln 7A + Ln 7B) A. Max Rev/Memb x Cur Memb Avg (Ln 5 x Ln 6) B. Hold Harmless Non-Recurring Exemption 0.00 11,000.00 14,063 154,693,000 (from left) (rounded) 154,693,000 0 15/2
Determine Recurring Exemptions Revenue Limit Summary 7. 2023-24 Rev Limit, No Exemptions (Ln 7A + Ln 7B) A. Max Rev/Memb x Cur Memb Avg (Ln 5 x Ln 6) B. Hold Harmless Non-Recurring Exemption 8. Total 2023-24 Recurring Exemptions (A+B+C+D+E) A. Prior Year Carryover B. Transfer of Service C. Transfer of Territory/Other Reorg (if negative, include sign) D. Federal Impact Aid Loss (2021-22 to 2022-23) E. Recurring Referenda to Exceed (If 2023-24 is first year) 9. 2023-24 Limit with Recurring Exemptions (Ln 7 + Ln 8) Carryover to FY25, if applicable (rounded) 154,693,000 Amount 62,746,400.00 60,286,400.00 154,693,000 Category 0 Allowable Limited Revenue (rounded) 5,686,106 Fund 10, PI-401 Fund 38, PI-401 Fund 41, PI-401 0 0.00 686,106 2,460,000.00 62,746,400.00 0 0 Line 14 Total (Revenue Limit Levies) Over Levy Under Levy 0.00 0.00 0.00 5,000,000 160,379,106 24-25 Base-Building Information Total non-recurring exemptions (10 + 7B) Levied total non-recurring exemptions* Amount 8,053,171.35 8,053,171.35 *to be removed from next year's base 16/2
Determine Non-Recurring Exemptions 9. 10. Total 2023-24 Non-Recurring Exemptions (A+B+C+D+E+F+G+H+I) A. Non-Recurring Referenda to Exceed 2023-24 Limit B. Declining Enrollment Exemption for 2023-24 (from left) C. Energy Efficiency Net Exemption for 2023-24 (see pg 4 for details) D. Adjustment for Refunded or Rescinded Taxes, 2023-24 E. Prior Year Open Enrollment (uncounted pupil[s]) F. Reduction for Ineligible Fund 80 Expenditures (enter as negative) G. Other Adjustments (Fund 39 Bal Transfer) H. WPCP and RPCP Private School Voucher Aid Deduction I. SNSP Private School Voucher Aid Deduction 11. 2023-24 Revenue Limit With All Exemptions (Ln 9 + Ln 10) 2023-24 Limit with Recurring Exemptions (Ln 7 + Ln 8) 160,379,106 8,053,171 0 462,000 0 8,742 121,322 0 0 6,564,100 897,007 168,432,277 NR exemptions are subtracted out when building next year s base! 17/2
Line 10D vs Line 15C Line 10D: Adjustment for Refunded or Rescinded Taxes Property taxpayer contests assessment and value of property is reduced Districts allowed to increase RL by the amount refunded as a result of a valuation re-determination under s. 74.41 DOR computes amounts each fall and sends letters in mid-November; DPI pre-populates this field based on certified amounts provided by DOR Statutes do not permit RL exemption for any other kind of chargeback Line 15C: Prior Year Levy Chargeback for Uncollectible Taxes Municipality unable to collect full amount from property taxpayer after full levied amount provided to district Municipality asks the district to return the uncollectible amount under s. 74.42 District recovers the amount returned to municipality through an outside of the RL chargeback levy instead of an adjustment 18/2
Determine Your Levy 11. 2023-24 Revenue Limit With All Exemptions (Ln 9 + Ln 10) 12. Total Aid to be Used in Computation (12A + 12B + 12C + 12D) A. 2023-24 OCT 15 CERT OF GENERAL AID B. State Aid to High Poverty Districts ($0 per 2023 Act 19) C. State Aid for Exempt Computers (Source 691) D. State Aid for Exempt Personal Property (Source 691) DISTRICTS MUST USE THE OCT 15 AID CERT WHEN SETTING THE DISTRICT LEVY. 168,432,277 105,685,877 104,558,048 0 663,541 464,288 13. Allowable Limited Revenue: (Line 11 - Line 12) (10, 38, 41 Levies) 62,746,400 The 2023 Act 12 exempt personal property payment is not included on line 12D. Code to Source 691. 19/2
Determine Your Levy 13. Allowable Limited Revenue: (Line 11 - Line 12) (10, 38, 41 Levies) 14. Total Limited Revenue To Be Used (A+B+C) Entries Required Below: Enter amnts needed by purpose and fund: A. Gen Operations: Fnd 10 Src 211 B. Non-Referendum Debt (inside limit) Fund 38 Src 211 C. Capital Exp, Annual Meeting Approved: Fund 41 Src 211 15. Total Revenue from Other Levies (A+B+C+D) A. Referendum Approved Debt (Fund 39 Debt-Src 211) B. Community Services (Fund 80 Src 211) C. Prior Year Levy Chargeback for Uncollectible Taxes (Src 212) D. Other Levy Revenue - Milwaukee & Kenosha Only 16. Total Fall, 2023 REPORTED All Fund Tax Levy (14A + 14B + 14C + 15) 16. Total Fall, 2023 REPORTED All Fund Tax Levy (14A + 14B + 14C + 15) 13. Allowable Limited Revenue: (Line 11 - Line 12) (10, 38, 41 Levies) 14. Total Limited Revenue To Be Used (A+B+C) Entries Required Below: Enter amnts needed by purpose and fund: A. Gen Operations: Fnd 10 Src 211 B. Non-Referendum Debt (inside limit) Fund 38 Src 211 C. Capital Exp, Annual Meeting Approved: Fund 41 Src 211 15. Total Revenue from Other Levies (A+B+C+D) A. Referendum Approved Debt (Fund 39 Debt-Src 211) B. Community Services (Fund 80 Src 211) C. Prior Year Levy Chargeback for Uncollectible Taxes (Src 212) D. Other Levy Revenue - Milwaukee & Kenosha Only 62,746,400 62,746,400 EXCEEDS LIMIT !! Not >line 13 Not >line 13 62,746,400 62,760,000 60,300,000 (Proposed Fund 10) 0 (to Budget Rpt) 60,286,400 (Proposed Fund 10) 0 (to Budget Rpt) 2,460,000 (to Budget Rpt) 2,460,000 (to Budget Rpt) 15,438,009 15,438,009 12,768,252 2,655,278 14,479 14,479 12,768,252 2,655,278 (to Budget Rpt) (to Budget Rpt) (to Budget Rpt) (to Budget Rpt) (to Budget Rpt) (to Budget Rpt) 78,184,409 78,198,009 0 0 Tip: Enter Funds 38 & 41 first 20/2
Levy by municipality Proportions change! 22/2
Levy Rate Fall 2023 Property Values 2023 TIF-Out Tax Apportionment Equalized Valuation 11,972,391,961 1. This 2. Divided by this 16. Total Fall, 2023 REPORTED All Fund Tax Levy (14A + 14B + 14C + 15) Line 16 is the total levy to be apportioned in the PI-401. 78,198,009 0.00653153 Levy Rate = 3. Yields your levy rate 23/2
Mill Rate Levy Rate * 1,000 = Mill Rate Property tax dollars levied per $1,000 in equalized value Mill rate of 10.00 on a $300,000 house owner pays $3,000 in school property tax Consistent mill rate same taxes! Lower mill rate lower taxes! Statewide property values up 44% FY24 vs FY20 levies 24/2
Timeline October 15: Oct. 15th General Aid Certification released November 1: Deadline for school boards to approve levies November 4: Deadline to submit Tax Levies Report November 8: Deadline for district clerks to inform municipal clerks of their share of the tax levy (usually the 10th) 25/2
Revenue Limits How can I predict future limits? SFS Home Revenue Limits Overview 2024-25 Pre-Populated Revenue Limit Worksheet Historical Revenue Limit Worksheets Longitudinal Revenue Limit Worksheet 26/2
WISCONSIN DEPARTMENT OF PUBLIC INSTRUCTION SURVEY OF REVENUE LIMIT FORMULA COMPONENTS: 2011-12 TO 2023-24 Appleton Area 2014-15 2015-16 2016-17 2017-18 2018-19 2019-20 2020-21 2021-22 2022-23 2023-24 1.) Base Revenue 2.) Base 3-Year Membership 3.) Base Revenue Per Member (Line 1 Line 2) 4.) Per-Member Increase 5.) Maximum Revenue Per Member (Ln 3 + Ln 4) 6.) Current 3-Year Membership 7.) Total Maximum Revenue Limit (no exemptions) a. Max Rev/Memb x Cur Memb Avg (ln 5 x Ln 6) b. Line 7 Hold Harmless Non-Recur Exemption 8.) Recurring Exemptions a. Prior Year Carryover b. Transfer of Service c. Transfer of Territory d. Federal Impact Aid Loss e. Recurring Referenda to Exceed (if year 1) 9.) Limit with Recurring Exemptions (Ln 7 + Ln 8) 10.) Non-Recurring Exemptions a. Non-Recurring Ref b. Declining Enrollment Exempt c. Energy Efficiency Exemption (begins in 2009-10) d. Adj for Refunded/Rescinded Taxes e. Prior Year Open Enrollment (uncounted pupils) f. Reduction for Ineligible Fund 80 Expends g. Environmental Remediation Exemption h. Adjustment for New Choice Pupils i. Adjustment for New Special Needs Scholarship Pgm Pupils 11.) Maximum Revenue Limit wth Exemptions (Ln 9 + Ln 10) 12.) General Aid Cert (Gen+High Poverty Aid+Comp Aid+Pers Prop Aid) 13.) Allowable Limited Rev 10, 38, 41 Levy (Ln 11 - Ln 12) 14.) Limited Revenue Used (includes levies 10, 38, & 41) 15.) Total Revenue from Other Levies 16.) Low Revenue Ceiling Aid (only in 2011-12) 16.) / 17.) Total Levy+Src 691 17.) / 18.) Computer Aid (for applicable years) 135,400,310 14,327 144,044,281 14,592 146,937,739 14,883 148,176,627 15,006 148,830,602 15,059 149,061,167 15,078 150,700,516 14,972 10,065 150,611,866 14,692 10,251 147,485,270 14,381 10,256 144,870,910 14,105 10,271 Longitudinal Revenue Limit 9,451 9,871 9,873 9,874 9,883 9,886 175 10,061 14,972 75 0 0 0 0 179 0 0 729 9,526 14,592 9,871 14,883 9,873 15,006 9,874 15,059 9,883 15,078 10,244 14,692 10,251 14,381 10,256 14,105 11,000 14,063 138,999,160 138,999,160 146,916,939 146,916,939 148,152,137 148,152,137 148,699,945 148,699,945 149,018,437 149,018,437 150,633,292 150,633,292 150,700,516 150,512,047 188,469 99,819 150,611,866 147,423,658 3,188,208 61,612 147,485,270 144,654,674 2,830,596 216,236 154,693,000 154,693,000 0 0 0 0 0 0 0 5,045,121 20,800 24,490 130,657 42,730 67,224 5,686,106 0 0 0 0 0 0 0 0 0 0 45,121 20,800 24,490 130,657 42,730 67,224 99,819 61,612 216,236 686,106 0 0 0 0 0 0 0 0 0 0 0 0 0 0 0 0 0 0 0 0 0 0 0 0 0 0 0 0 5,000,000 144,044,281 395,165 5,000,000 160,379,106 8,053,171 146,937,739 955,779 148,176,627 901,646 148,830,602 1,228,388 149,061,167 2,045,093 150,700,516 4,261,670 150,800,335 6,966,491 150,673,478 7,823,232 147,701,506 8,602,927 0 0 0 0 0 0 0 0 0 0 0 0 0 0 0 0 0 0 0 0 1,066,466 2,868,457 3,188,148 2,830,535 462,000 0 0 0 0 0 13,581 381,584 30,261 42,022 97,988 12,133 3,764 232,609 2,307 86,346 217,813 115,614 70,797 43,515 39,426 120,631 8,742 121,322 0 0 0 0 0 0 0 0 0 0 0 0 0 0 0 0 0 0 0 0 0 0 0 0 883,496 791,525 1,224,624 1,812,484 3,004,767 101,784 154,962,186 94,807,461 60,154,725 3,328,066 436,541 157,766,826 95,580,709 62,186,117 4,105,746 415,026 158,496,710 95,897,348 62,599,362 4,821,855 790,480 156,304,433 99,550,953 56,753,480 6,564,100 897,007 168,432,277 105,685,877 62,746,400 0 0 0 0 144,439,446 82,155,170 62,284,276 147,893,518 84,119,335 63,774,183 149,078,273 87,640,339 61,437,934 150,058,990 88,598,913 61,460,077 151,106,260 90,971,661 60,134,599 61,893,722 63,764,312 61,388,570 61,776,061 60,144,482 60,154,725 62,114,406 62,589,111 56,743,224 62,746,400 4,805,981 4,800,135 4,985,885 5,989,386 8,202,735 9,655,050 9,626,773 10,093,923 17,747,392 15,438,009 n/a n/a n/a n/a n/a n/a n/a n/a n/a n/a 66,699,703 499,417 68,564,447 578,404 66,374,455 638,099 67,765,447 647,479 68,347,217 Moved to Line 12 in 2018-19 68,347,217 8.6765 7,877,234,972 69,809,775 71,741,179 72,683,034 74,490,616 78,184,409 0 0 0 0 0 18.) / 19.) Total All-Fund Tax Levy Levy Rate (in mils) TIF Out Tax Apportionment Value Under Limit* (Line 14 < Line 13) Over Limit (Line 14 > Line 13) Change from prior year - Total All-Fund Tax Levy 66,200,286 9.5442 6,936,192,827 $390,554 67,986,043 9.6035 7,079,269,550 65,736,356 9.0642 7,252,328,337 $49,364 67,117,968 8.7752 7,648,631,179 69,809,775 8.3202 8,390,434,565 71,741,179 7.9582 9,014,775,214 72,683,034 7.6559 9,493,679,888 74,490,616 7.1000 10,491,604,760 78,184,409 6.5304 11,972,391,961 $9,871 $0 0 0 71,711 10,251 10,256 0 27/2 $0 $0 $0 $315,984 2.10% $9,883 1.83% $0 $0 $0 $0 $0 3.35% 2.70% -3.31% 2.14% 2.77% 1.31% 2.49% 4.96%
Questions? DPI School Financial Services Team https://dpi.wi.gov/sfs dpifin@dpi.wi.gov 608-267-9114 Jennifer Buros, Director Ben Kopitzke, Finance Consultant 608-266-1966 608-267-9279 28/2

