Revenue Management Strategies and Techniques
Explore the concept of revenue management, which involves setting prices based on inventory control and demand forecasting to maximize profits. Learn about different pricing strategies and segmentation techniques to attract the right customers at the right time for optimal revenue.
Uploaded on | 0 Views
Download Presentation

Please find below an Image/Link to download the presentation.
The content on the website is provided AS IS for your information and personal use only. It may not be sold, licensed, or shared on other websites without obtaining consent from the author. If you encounter any issues during the download, it is possible that the publisher has removed the file from their server.
You are allowed to download the files provided on this website for personal or commercial use, subject to the condition that they are used lawfully. All files are the property of their respective owners.
The content on the website is provided AS IS for your information and personal use only. It may not be sold, licensed, or shared on other websites without obtaining consent from the author.
E N D
Presentation Transcript
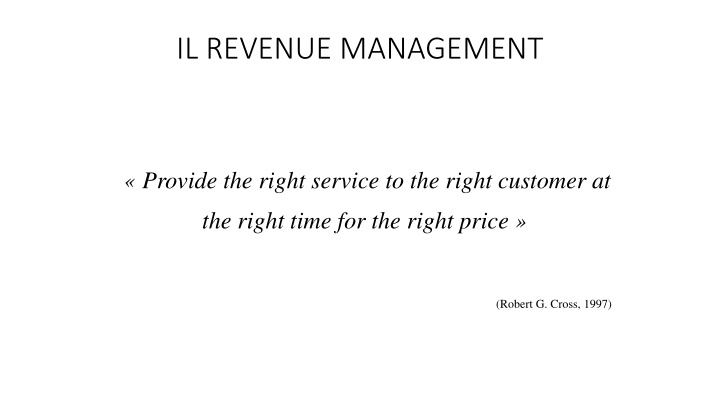
IL REVENUE MANAGEMENT Provide the right service to the right customer at the right time for the right price (Robert G. Cross, 1997)
Definition of revenue (yield) management Business practise to set prices when there is perishable inventory (e.g., fruit vendor) Intuition: Limited inventory, raise prices Excess inventory, lower prices or Prices too high, left over inventory (low revenue) Prices too low, inventory sold too soon (low revenue) Demand forecasting is the pre-requisite in oder to maxime revenue Different levels of sophistication: fruit vendor vs. airline networks
Inventory control in Revenue Management Main question: how much to sell at a given price and whom to sell to?! Optimizing models used for inventory control: Littlewood s rule Booking limits, Protection levels Expected marginal seat revenue (EMSR) Virtual Nesting Bid prices Overbooking Task: Calculate the protection levels (inventory control) and apply them to the reservation systems!
Uniform Uniform vs vs differentiated differentiated prices prices: : price price discrimination discrimination increases increases profits profits and, and, if if the the quantity quantity increases, increases, also also social welfare social welfare Price Quantity sold Revenue 400 300 200 100 20 20 20 20 80 8000 6000 4000 2000 20000 200 16000 4000 Uniform price 250 Quantity sold 50 Total revenue 12.500 Total quantity sold Average cost at 80 Total cost Profit Average cost at 50 300 Total cost 15.000 Profit -2.500
Determine Determine the fare possible possible segmentations segmentations the fare structure structure to discriminate to discriminate among among travellers: travellers: Main goal: distinguish among Leisure and Business Customers: how? Examples: Advance purchase (AP): AP7 (at least 7 days in advance), AP15 (15 days in advance) Minimum stay (MS): MS 3 day Include Saturday and Sunday Non refundable (NR) Mandatory return trip (RT) Discounted (walk up): special offer Unrestricted (walk up): just board the plane Luggage Fast boarding lines
Link the fare to the travel restrictions: nesting structure Protection Level 0 Booking Limit 100 Fare Travel restrictions no restriction 500$ Y Advance purchase: 7 day no reimbursement 400$ M 40 60 Advance purchase: 7 day no reimbursement 3 day Min. Stay Round Trip 350$ H 50 50 Advance purchase: 14 day - no reimbursement 3 day Min. Stay Round Trip 300$ K 35 65 BOOKING LIMITS = CAPACITY PROTECTION LEVEL Capacity: 100 seats Customers willing to pay less ask for the service earlier than the customers willing to pay more The tariff structure must be tested: it is necessary to see how customers and competitors react The tariff structure rarely changes, more often the levels of protection are modified
How to determine the protection levels: inventory control
Example Example Only 1 seat is still available on the airplane. 2 possible fares: FL: 100$, FH: 200$ Two possibilities: If a customer willing to pay a high fare shows up first, sell him the seat (no problem!). If a customer willing to pay a low fare shows up first, should I sell him the seat? (Problem!) What if an high-fare customer shows up soon afterwards? How should I decide? Littlewood s Rule: compare the revenue that you would get for sure with the expected revenue!! FL FH Pr (probability that a higher-fare customer FHwould show up before the airplane take-off)
Find the probability needed to sell the seat at the lower Find the probability needed to sell the seat at the lower fare (critical probability) fare (critical probability) If FH=200, FL=100 Prob =FL/ FH Pr (DH c) =100/200=0.5 (critical probability) If the probability than a high-fare customers FH would arrive is greater than 0.5, then do not sell the seat for 100 If the probability than a high-fare customers FH would arrive is lower than 0.5, then do sell the seat for 100 Test of the rule: If Prob= 0.6, expected marginal revenue = 200*0.6=120, that is higher the FL If Prob= 0.4, expected marginal revenue = 200*0.4=80, that is lower than FL
Littlewoods Littlewood s rule rule Determine the optimal protection level (inventory control) for a single-leg flight with 2 fares FL FH Pr (XH H) FL: low fare, FH: high fare XH: demand for the high fare H H: protection level Pr (XH H): probability that more than Hclients show up FH Pr (XH H) expected marginal revenue deriving from a seat if sold at a high fare
How How many many seats protect protect? ? seats should should we we FL(100$) FH (200$) Prob [x > H] Pr (XH H): probability that more than Hclients show up H = protection level Inequality satisfied? comments Expected marginal revenue at H Prob (xH H) 2 80% 200*0.8=160$ No: 100$ (200*0,8)= 160$ Protect at least 3 seats 3 60% 200*0.6=120$ No: 100$ (200*0,6)= 120$ Protect at least 4 seats 4 40% 200*0.4=80$ Yes: 100$ (200*0,4)= 80$ Do not protect 5 seats 5 30% 200*0.3=60$ Yes: 100$ (200*0,3)= 60$ Do not protect 6 seats Do not protect 7 seats 6 20% 200*0.2=40$ Yes: 100$ (200*0,2)= 40$ Solution: Protect 4 seats for the higher-fare customers and sell the remaining seats to the lower-fare customers
Determine how many rooms to reserve for the high fare customers on the basis of the demand observed in the last 123 days Simulate with lower fares FH times the probability that more than 78 clients willing to pay the FH show up is higher than FL. That is EMSR (78) is higher than FL. Therefore, I protect 79 rooms for the high fare customers. Since 210 are available, 131 rooms would be available for the low fare customers! Expected marginal revenue = FH* Prob(x>Theta H) Certain vs. uncertain Rooms sold at the higher fare H Probability that at least X rooms would be sold at the higher fare H Probability that exactly X rooms would be sold at the higher fare H Revenue that I would make with certainty Probability that more than X rooms would be sold at the higher fare H
Two important requirements for RM 1. Accurate demand forecasting (demand probability function): it is necessary to have as much quantitative and qualitative information as possible (by season, by type of ticket, by age group, etc.) 2. Optimization (in the case of a network): it is necessary to have a good and easy way to apply decision rules (control mechanism such as the protection level or the bid price)
EMSR ( EMSR (Expected Expected Marginal Marginal Seat Seat Revenue Revenue) ): with 4 fares (EMSR (Expected Marginal Seat Revenue) a): Extension of the Littlewood s rule from 2 to 4 fares. (We want to protect the seats for the clients who are willing to pay more ) : Peter Belobaba (MIT, USA) EMSR = FH Pr (XH H) Prot. Level 4, j Prot. Level 3, j Prot. Level 2, 1 There are 150 seats available: (Prot. Level 4,j): How may sets to protect for the customers willing to pay the $290 fare and not only the $125 fare, for the customers willing to pay the $420 fare and not only the $125 fare, for the customers willing to pay the $500 fare and not only the $125 fare. (Prot. Level 3,j): How may sets to protect for the customers willing to pay the $420 fare and not only the $290 fare, for the customers willing to pay the $500 fare and not only the $290 fare. (Prot. Level 2,1): How may sets to protect for the customers willing to pay the $500 fare and not only the $420 fare. St.Dev. * Class Fare Mean* 1 500$ 16,5 5,6 20 15 11 2 420$ 44,2 15,0 52 37 3 290$ 35,1 11,2 37 4 125$ -- -- Total 109 52 11 *Assuming a normal distribution
calcoli How many seats to protect vs. class 4 125>=290 Pr (XH H), H=37 125>=420 Pr (XH H), H=52 125>=500 Pr (XH H), H=20 How many seats to protect vs. class 3 290>=420 Pr (XH H), H=15 290>=500 Pr (XH H), H=37 How many seats to protect vs. class 2 420>=500 Pr (XH H), H=11 Sum along the classes (column) Calculate the booking limits (how many seats to reserve to each class) The level of protection does not correspond to the expected demand (11 compared to 16.5) for two reasons: It depends not only from the mean but also the standard deviation The level of protection reflects the marginal revenue of a fare compared to another fare (the difference is important)
Total capacity (inventory): 150 seats Booking Limits = Inventory Protection Level Fare Protection Level: not available seats $125 $290 $420 $500 109 52 11 -- Booking Limits: available seats 41 98 139 150 Prescriptions: If someone is willing to pay $ 500 for a seat, sell it to him; If someone is willing to pay $ 420 for a seat, sell it up to 139 seats; If someone is willing to pay $ 290 for the seat, sell it up to 98 seats; If someone is willing to pay $ 125 for the place, sell it up to 41 seats;
The issue is much more complex if you sell a service organized in a network
Example of a network. Two issues: 1. Very many fares in a network 2. Leg vs. network control Virtual nesting BOS JFK MIA BOS Y: 375$ B: 325$ M: 275$ LAX JFK LAX JFK MIA Y: 600$ B: 500$ M: 400$ JFK MIA MIA Y: 500$ B: 450$ M: 400$ .. having only one free seat on the JFK MIA flight, whom passenger should I sell it to?! Would it be more convenient to sell it to the one who buys the LAX MIA flight for $ 600 or to the passenger who buys the JFK MIA single leg for $ 500? The LAX MIA passenger pays a higher fare but he occupies 2 seats ...
The issue of the very many fares in a network was solved by VIRTUAL NESTING. American Airlines developed the concept of virtual buckets identified by fare ranges. The protection levels are calculated for the buckets instead of by single fares. But it is still a leg level control! VIRTUAL NESTING VALUE RANGE ITINERARIES 1 2 450$ - 600$ 350$ - 449$ LAX JFK MIA (Y), LAX JFK MIA (B), JFK MIA (Y), JFK MIA (B) BOS JFK MIA (Y), LAX JFK MIA (M),JFK MIA (M) 3 200$ - 349$ BOS JFK MIA (B), BOS JFK MIA (M)
Leg Leg- -level control vs. network control level control vs. network control Leg level control: it considers flights as indipendent Origin-destination control: it considers the entire network .. having only one free seat on the JFK flight, whom passenger should I sell it to? Would it be more convenient to sell it to the one who buys the LAX or to the passenger who buys the JFK single leg for $ 500? Pay attention that the LAX pays a higher fare but occupies 2 seats ... MIA MIA flight for $ 600? MIA MIA passenger
Leg Leg- -level control vs. level control vs. network network control. control. The The Bid price (BP) Bid price (BP) solution solution The issue is solved by calculating the BID PRICES. Since an airplane's capacity is fixed, there is an opportunity cost to allocate a seat, equal to the expected gain that one believes one can get with that seat (the same logic as the Littlewood rule: certain value vs. expected value). Such opportunity cost (shadow price) is called BID PRICE. Instead of loading on the computer system the booking limits (protection levels), one loads the bid prices for each leg.
How to use the bid prices (in red) Rule: compare the fare to the Bid Price (opportunity cost of that seat) LAX-MIA uses two seats: the BPs are summed up (200 + 150 = 350): fare Y is accepted, fare B is not BOS-MIA uses two seats: the BPs are summed up (0 + 150 = 150): Fares Y, B, M are all accepted JFK-MIA: Fares Y, B, M are all accepted Two difficulties: 1) Shared networks, 2) Dynamic BP update
How to How to calculate calculate Bid Bid Prices Prices Bid Prices are determined at leg level via linear (non linear, stochastic) programming optimization models at network level. Bid Prices are estimated periodically
Objective function! Constraint on machine A time in minutes Constraint on machine B time in minutes X >= demand (75) - initial stock (30), which ensures we meet demand Y >= demand (95) - initial stock (90), which ensures we meet demand
Solution of the linear programming example Finding the combination of X and Y that generate the higher profits while at the same time respecting the constraint. The solution is x=45 and y=6.25 with the value of the objective function being 1.25 Suppose that the working hour on X are reduced from 40 to 38, that would be the opportunity cost (foregone profit) of an hour of X. The bid prices for a seat on a leg are similarly calculated! the maximum occurs at the intersection of x=45 and 50x + 24y = 2400
LP with Excel Solver What is the optimal mix of the two types of Tablet Models? https://www.youtube.com/watch?v=6xa1x_Iqjzg&t=48s
LP with Excel Solver Shadow price: any unit increase\decrease in the resource availabe increase profits by the shadow price: 53 for Chips sets 8.6 for Electronic components 0 for Labour hours (not binding) Shadow price= bid price, cost of a used resource at the margin
Overbooking Commercial technique consisting in the sale of a higher number of tickets than the actual seats available on the aircraft to take into account the possibility that some travelers do not show up. It consists in balancing out the marginal revenue to sell more seats with marginal cost to compensate for the traveler who did not find a place on the plane Hotels, rental car agencies, some restaurants, and even some non- emergency health-care providers overbook.
200 rooms available in the hotel fH: 159$, fL: 105$ the number of customers who book a room but fail to show up on the night in question is Normally distributed with mean 20 and standard deviation 10 Costs: 300$ the cost of alternative accommodation + 105$ a gift certificate for a one-night stay Revenue for sure vs. uncertain loss 14 seats could be overbook. The total number of booking allowed is 214.
Summary on revenue management Aim: Optimal management of a perishable good\service. Method: Price discrimination! It increases revenue (profit) and might increase the quantity sold and the social well-being (private profit + consumer surplus) Procedure: Segment the service; Forecast the demand; Provide the right service to the right customer (inventory control) at the right time calculating the protection levels, the booking limits, the bid prices, and the overbooking levels. The improvement over uniform pricing is so much higher: the better we forecast demand, the more the demand is differentiated among customers, and the more sophisticated is the technique used to evaluate the optimal prices.

