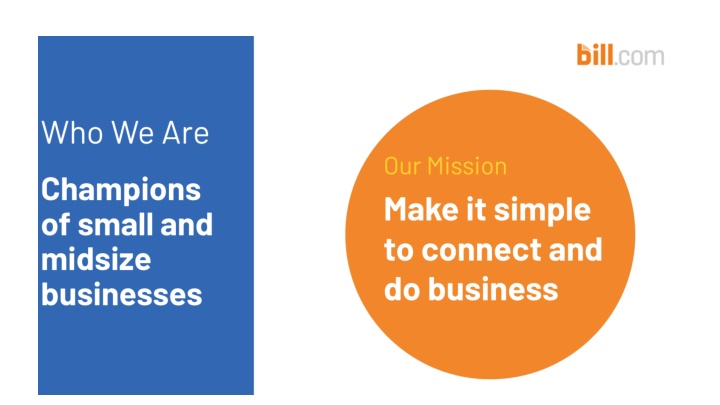
Revolutionizing Revenue Opportunities: Data Science at bill.com
Unlock the power of data science with Stuart Ogawa, Senior Director at bill.com, to hunt down revenue opportunities using cutting-edge analytics. Dive into a world of predictive insights and recommendations that can transform your revenue streams. Join the team at bill.com and shape the future of revenue optimization.

Download Presentation

Please find below an Image/Link to download the presentation.
The content on the website is provided AS IS for your information and personal use only. It may not be sold, licensed, or shared on other websites without obtaining consent from the author. If you encounter any issues during the download, it is possible that the publisher has removed the file from their server.
You are allowed to download the files provided on this website for personal or commercial use, subject to the condition that they are used lawfully. All files are the property of their respective owners.
The content on the website is provided AS IS for your information and personal use only. It may not be sold, licensed, or shared on other websites without obtaining consent from the author.
E N D
Presentation Transcript
Stuart Ogawa Senior Director, Growth Analytics and Data Science at bill.com I hunt revenue opportunities using data science LinkedIn https://www.linkedin.com/in/stuartogawa/ U.C.S.B 1986 30 years+ technology experience Founder, Co-founder, EVP, General Manager, CTO, VP in Product, Research Labs, Engineering and Operations roles Self funded, angel investor, VC, Private Equity, pre and post IPO experience 60+ patents filed to date 10+ patents granted to date 6+ patents PTC positive opinion to date Taught 30+ global lectures and seminars on Agile software development and intellectual property
The Opportunity Help us search, analyze, predict and recommend the next revenue opportunities at bill.com! Apply your math, data science, machine learning and deep learning skills against millions of anonymized businesses and transactions I will teach, lead and mentor you in order to help you succeed Your work seen at the highest levels at bill.com Bottom line...no matter what company you work for, if your work directly impacts top line revenue, there will always be a role for you somewhere. Here s your first shot.
The Details Objective of research - "What and Why" Predict and identify which business archetypes, industry segments, and entities can drive expanded revenue from existing customers and identify new customer entities (within an industry segment) that drive more unit sales. Proposed Method - "How" Proposed Method - "How" BDC UCSB Capstone Team Researches, chooses and works the how Stu rolls up sleeves to work with team Weekly office hours availability Retrospect sit ins Sprint show and tell sit ins Demo reviews Industry insights and how to s Selects a firmographic business archetype(s) Selects N number of industries within the archetype Provides anonymized entities and corresponding historical transaction data (no PII) Big data - historical data window (2015, 2016, 2017, 2018 and 2019) for seed / training set
Project Phases Phase I (version 1) Provide 2015, 2016, and 2017 anonymized and historical transaction data to students Students use machine learning/deep learning to predict 2018 transaction processing value (TPV) by entity Students incorporate 3rd party data (industry public data) to correctly bias and increase 2018 TPV predictability Deliverable: Students present their 2018 TPV by entity and then rollup by industry Deliverable: Students present and explain "how" they came up with their predictions - explainability We subsequently provide students with 2018 data and they can see how close / off their predictions are by entity and industry Phase 2 (version 2) Students use 2018 data to predict 2019 TPV data and refine their prediction machine learning / deep learning algos Students incorporate 3rd party data (industry specific public data) to correctly bias and increase 2019 TPV predictability Deliverable: Students present their 2019 TPV by entity and then rollup by industry Deliverable: Students present and explain "how" they came up with their predictions We subsequently provide students with 2019 data and they can see how close / off their predictions were by entity and industry