Rhode Island Health Care Cost Trends Steering Committee Updates
Stay informed about the latest updates from the Rhode Island Health Care Cost Trends Steering Committee, including project funding, pharmacy spending analyses, policy recommendations, and upcoming meetings.

Download Presentation

Please find below an Image/Link to download the presentation.
The content on the website is provided AS IS for your information and personal use only. It may not be sold, licensed, or shared on other websites without obtaining consent from the author. If you encounter any issues during the download, it is possible that the publisher has removed the file from their server.
You are allowed to download the files provided on this website for personal or commercial use, subject to the condition that they are used lawfully. All files are the property of their respective owners.
The content on the website is provided AS IS for your information and personal use only. It may not be sold, licensed, or shared on other websites without obtaining consent from the author.
E N D
Presentation Transcript
Rhode Island Health Care Cost Trends Steering Committee October 26, 2020 1
Agenda 1. Welcome 2. Brief project funding update 3. Highlights from Brown s analyses of pharmacy spending, review of policy options and recommendations for action 4. Value-based payment 5. Upcoming Steering Committee meetings a. Agendas/workplan b. 2021 meeting frequency 6. Public comment 7. Next steps and wrap-up 2
Brief project funding update During our August meeting, we shared that the state budget was in flux due to the pandemic and that project staff were discussing continency plans with the Peterson Foundation, but limited funding would result in a decrease in the project s scope. The Governor s proposed funding mechanism via an assessment has had hearings in both the House and Senate. The State FY 21 budget may be voted on in November of 2020, amid uncertainty associated with revenues and deficits. We are grateful that a few weeks ago, the Peterson Foundation approved a revised project scope and budget for project funding until August of 2021. The RI Foundation has also agreed to fund the development of a communications strategy for both internal and public stakeholder engagement. 4
Highlights from Browns analyses of pharmacy spending, review of policy options, and recommendations for action Note for the Steering Committee: This presentation includes the full materials shared for the 10/23 public meeting. Only a subset of these slides will be presented during the Steering Committee meeting. 5
Agenda 1. Drug Costs: Retail Pharmacy and Medical Pharmacy Costs 2. Pharmaceutical Costs as Drivers of Total Cost 3. Pharmaceutical Costs as Drivers of Cost Trends 4. Utilization vs Price 5. Retail Pharmacy Costs: Deeper Dive 6. Medical Pharmacy Costs: Deeper Dive 7. Conclusions 6
Pharmacy Costs Retail Pharmacy costs or spend: refers to prescription medicines purchased in retail pharmacies Medical pharmacy costs or spend: refers to prescriptions administered in providers offices and hospitals Less appreciated by many as a part of the overall drug spend Appears in claims files as part of Professional Services Identified by J Codes Growing rapidly 8
Total PMPM: Commercial Insurance Note: these numbers are similar but not identical to the aggregate numbers you saw presented earlier. 10
% PMPM: Commercial Insurance Retail Pharmacy + Medical Pharmacy = significant and growing fraction of total PMPM 11
Total PMPM: Medicaid MCO Note: these numbers are similar but not identical to the aggregate numbers you saw presented earlier. 12
% PMPM: Medicaid MCO Retail Pharmacy + Medical Pharmacy = significant and growing fraction of total PMPM 13
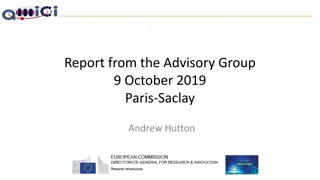
Cumulative Change in PMPM ($) since 2016 Drivers of Trend: Commercial Insurance 53% of cost increase = retail & medical pharmacy 15
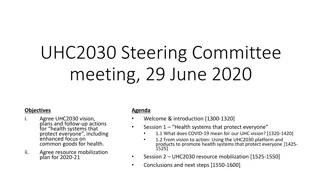
Cumulative Change in PMPM ($) since 2016 Drivers of Trend: Medicaid MCO 41% of cost increase = retail & medical pharmacy 16
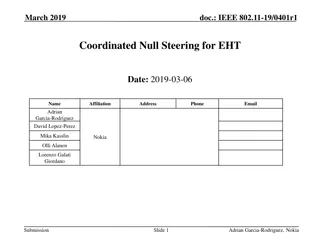
Commercial: Utilization vs. Price Cost increases driven by price, particularly in medical pharmacy, where utilization actually trended downward 2017-18 19
Medicaid MCO: Utilization vs. Price Cost increases driven mostly by price, particularly in medical pharmacy 21
Total Cost, Top 5 Drug Classes in color (of 18 classes) 23
Total Cost: Top 5 Drug Classes 24
Commercial Top 5 Classes: Utilization vs. Price Price increases are dramatic 25
Medicaid MCO Top 5 Classes: Utilization vs. Price Price increases are dramatic 26
Some drugs are moderately expensive per dose, but used by relatively large numbers of patients 28
Other drugs are extremely expensive and used by very few patients 29
Commercial % of Medical Pharmacy Spend: Top 10 Medications More than half of the spending is on the top 10 drugs 31
Commercial % of Medical Pharmacy Spend: Top 10 Medications Small % of beneficiaries use these top 10 medications 32
Medicaid MCO % of Medical Pharmacy Spend: Top 10 Medications Just less than half of the spending is on the top 10 drugs 33
Medicaid MCO % of Medical Pharmacy Spend: Top 10 Medications Small % of beneficiaries use these top 10 medications 34
Medical Pharmacy Dramatic price increases Large portion of medical pharmacy spend is on a small number of very expensive drugs used by a few beneficiaries 36
Conclusions 37
Data Considerations Commercial data does not include claims from self-insured employers who elected not to submit, and claims from BCBS MA Total cost data excludes non-claims-based payments Data excludes manufacturer rebates, which vary in magnitude from 10% to 20% of total pharmacy costs If we adjusted for rebates, it would reduce the costs that we show 38
Conclusions Pharmaceutical costs are an important contributor to both costs and trends in costs Medical pharmacy is an important component of total pharmacy costs and should be monitored closely Price, not utilization, is what is driving cost increases Interventions to control pharmaceutical prices are needed 39
Policy options to address pharmacy spending As a reminder, our data use strategy outlines the importance of reviewing findings of analyses to identify possible actions to address identified opportunities. Policy solutions could include collaborative quality improvement activity, use of regulatory levers, introduction of legislation, among other options. During the public meeting, Trish Riley recommended the following strategies: 1. Assess penalties on manufacturers identified in annual ICER report as having a drug with an unsupported price increase 2. Develop an international reference rate using Canadian prices for a list of the 250 drugs costing the state the most Panelists reacted to these proposals and recommended additional potential policy options to address pharmacy spending. We will review these recommendations and then ask you for your recommendation for actions to address rising pharmacy spending. 40
Option #1: Penalties for Unsupported Price Increases Option #1: Penalties for Unsupported Price Increases Background: The Institute for Clinical and Economic Review (ICER) produces an annual report identifying the drugs with unsupported price increases outpacing 2x medical inflation that are the greatest drivers of net spending Unsupported price increases = unjustified by new clinical data What: State tax authority is used to assess penalties on manufacturers identified in annual ICER report as having a drug with an unsupported price increase Penalties = 80% of excess revenues (i.e., revenue from unsupported portion of price increase) Manufacturers must report information on total sales revenue in the state to the Tax Assessor to determine the penalty owed Impact: Because ICER s analysis targets drugs with the greatest impact on net spending, penalties can result in millions in revenue for a state -- revenue that the Model Act specifies must be used to offset costs to consumers
Option #2: International Reference Rates Option #2: International Reference Rates Why: Foreign countries pay a fraction of what Americans pay for prescription drugs Rate setting is a common approach in the health care sector one that can be extended to setting rates for prescription drugs International prices offer a fair, easy-to-implement approach to rate setting What: Develop a list of the 250 drugs costing the state the most The state references Canadian prices The lowest price becomes the international reference rate for payers in the state Impact: This model act can greatly lower prescription drug spending in a state - without running afoul of patent law through price setting.
Panel reactions and recommendations Panelists expressed interest in further examining: 1. ICER analyses of drugs with unsupported price increases 2. Lessons learned from the Rhode Island opioid tax when considering taxing drugs with unsupported price increases 3. Senator DiPalma s legislation to create an assessment on payers to help pay for high cost specialty drugs; these would be purchased by the State through negotiations with manufacturers 4. Prohibition of coupons or ensuring that all, including the uninsured, can access coupons Overall, the issue is complicated and there is room for action through legislation, regulation, and employer choice. But in taking action it is important to consider potential unintended consequences. 43
Panel reactions and recommendations Specific considerations include: Clinical Feasibility: Levers may be different for older drugs versus newer drugs that are still under patent protection Accessibility: It is important to consider what impact these policies may have on access to ensure that there is not an impact on access for Rhode Islanders (as seen with the opioid tax) Self-funded Plans: Make sure policies don t encourage markets to move to self- funded plans through voluntary inclusion; consider opportunities to link access to lower prices with self-funded plan data submission to the APCD (Gobeille?) Uninsured: Any policies created need to help the uninsured as well as those covered by insurance Impact on Consumers: Should reference prices be used, any legislation should consumers from paying the difference 44
Discussion Does the Steering Committee wish to act to advance either of Trish Riley s strategies, or other ideas discussed by the panel? Are there other pharmacy strategies of interest to Steering Committee members? What is the Steering Committee s recommendation for specific next steps to address rising pharmacy spending? 45
Methods to slow cost growth The primary objective of the Cost Trends project is to slow health care cost growth and thereby improve affordability for consumers, employers and state government. One method the Steering Committee has adopted to support cost growth target attainment is to mine APCD data to identify cost drivers and cost growth drivers, and then devise strategies to address them. A second potential approach is to identify and advance broad-based strategies that may impact overall cost growth without targeting one contributor in particular. Advanced valued-based payment is one such strategy the co-chairs have suggested. 47
Value-based payment Advanced value-based payment models are defined here to mean arrangements with: a prospectively defined budget with retrospective reconciliation and meaningful shared risk or a prospectively defined budget with prospective payment, and financial consequences for quality, These VBP models can align delivery system financial incentives with slowed cost growth and motivate substantial changes in care delivery. For this reason, OHIC s Affordability Standards have targeted increased adoption of value-based payment (aka alternative payment models). For the same reason, Oregon s equivalent of this Steering Committee has prioritized its collaborative work to further adoption of advanced VBP models. 48
OHIC Affordability Standards (selected text) 1. Health insurers shall take such actions as necessary to have fifty percent (50%) of insured medical payments made through an alternative payment model by January 1, 2021, and annually thereafter. The Commissioner shall issue a policy and guidelines manual by January 1 of each year that specifies the types of payments and payment models which may be credited toward the fifty percent (50%) target. 2. By January 2021, health insurers shall take such actions as necessary to have thirty percent (30%) of Rhode Island resident commercial insured covered lives attributed to a risk-sharing contract or global capitation contract. Risk-sharing contracts with ten thousand (10,000) or more attributed lives shall meet the Minimum Downside Risk requirements of this 4.10(D)(2)(d) of this Part. 49
OHIC Affordability Standards (selected text) 3. By January 1, 2021, at least ten percent (10%) of insured Rhode Island resident covered lives shall be attributed to a prospectively paid primary care alternative payment model. 4. Health insurers with thirty thousand (30,000) or more covered lives shall develop and implement new specialist alternative payment model contracts, and/or expand existing alternative payment model contracts with clinical professionals in the following specialties: Orthopedics; Gastroenterology; Cardiology; Behavioral health; and Maternity, Endocrinology, or other clinical specialties selected by the health insurer. For each specialty, the health insurer shall develop or expand at least two (2) contracts. 50


 since 2016")
 since 2016")


")
")