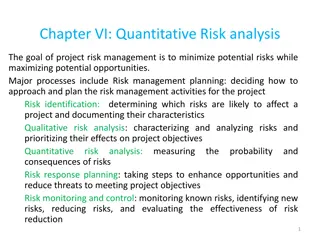
Risk and Return Analysis in Finance
Explore the concepts of expected returns, variance, and the Security Market Line in finance. Learn how to calculate expected returns, assess risk, and understand the relationship between risk and return in investment decisions.

Download Presentation

Please find below an Image/Link to download the presentation.
The content on the website is provided AS IS for your information and personal use only. It may not be sold, licensed, or shared on other websites without obtaining consent from the author. If you encounter any issues during the download, it is possible that the publisher has removed the file from their server.
You are allowed to download the files provided on this website for personal or commercial use, subject to the condition that they are used lawfully. All files are the property of their respective owners.
The content on the website is provided AS IS for your information and personal use only. It may not be sold, licensed, or shared on other websites without obtaining consent from the author.
E N D
Presentation Transcript
Return, Risk & the Security Market Line Chapter 12 1
Overview of Lecture 1. Expected Returns and Variance 2. Announcements, Surprises and Expected Returns 3. Risk: Systematic and Unsystematic 4. Diversification and Portfolio Risk 5. Systematic Risk and Beta 6. The Security Market Line 2
1.Expected Return Definition: The return on a risky asset expected in the future 3
1. Expected Return Example We have two equities, L and U: oEquity L is expected to have a return of 25% in the coming year oEquity U is expected to have a return of 20% for the same period There are two states of the economy: oIf the economy enters a recession, we think Equity L will have a -20% return and Equity U will have a 30% return oIf the economy booms, we think Equity L will have a 70% return and Equity U will have a 10% return We think a boom and a recession are equally likely to happen 4
1. Expected Return Example State of economy Probability of state of economy Rate of return if state occurs % Equity L Rate of return if state occurs % Equity U Recession 0.50 -20 30 Boom 0.50 70 10 1.00 5
1. Expected Return If you hold Equity U for a number of years, you ll earn 30% about half the time and 10% the other half. In this case, we say that your expected return on Equity U, E(RU), is 20%: E(RU) = (0.50 x 30%) + (0.50 x 10%) = 20% In other words, you should expect to earn 20% from this equity, on average. What is the expected return on L? 6
1. Variance To calculate the variances of the returns on our two equities, we first determine the squared deviations from the expected return. We then multiply each possible squared deviation by its probability. We add these up, and the result is the variance. The standard deviation is the square root of the variance. 8
1. Variance 0.10 - 0.20 = -0.10 9
1. Expected Return and Variance Equity L has higher expected return and is riskier 10
2. Announcements, Surprises and Expected Returns Total return = Expected return + Unexpected return R = E(R) + U R = actual total return in the year E(R) = expected part of the return U = unexpected part of the return E.g. research news, higher than expected sales figures, drop in interest rates 11
2. Announcements and News An announcement can be broken into two parts: Announcement = Expected part + Surprise The expected part of any announcement is the part of the information that the market uses to form the expectation, E(R), of the return on the equity. The surprise is the news that influences the unanticipated return on the equity, U. 12
3. Risk: Systematic and Unsystematic Unsystematic Risk Systematic Risk A risk that influences a large number of assets. Also, market risk or undiversifiable risk A risk that affects at most a small number of assets. Also, unique or asset- specific risk. 13
3. Risk: Systematic and Unsystematic Systematic Risk also known as Market Risks are those risks which affect all companies within a market in one way or another. For example: Inflation Recession Interest Rates Political Instability Exchange Rates War 14
3. Risk: Systematic and Unsystematic Unsystematic Risk also known as Specific Risk are risks which are unique to the company. Strength of Management (World Wide Technology) Range of Products (Unilever) Geographic Location (McDonald s) Financial Position (Google) Innovational Factor (Apple) Total Risk = Unsystematic Risk + Systematic Risk 15
4. The Principle of Diversification Spreading an investment across a number of assets will eliminate some, but not all, of the risk. 16
5. Portfolio Diversification After 30 or so equities, the diversification effect is small Diversification reduces risk, but only up to a point 17
4. Diversification and Unsystematic Risk Unsystematic risk is eliminated by diversification, so a portfolio with many assets has almost no unsystematic risk. Positive and negative company-specific effects cancel each other out 18
4. Diversification and Systematic Risk The total risk of an investment, as measured by the standard deviation of its return, can be written as: Systematic risk is also called non-diversifiable risk or market risk. Unsystematic risk is also called diversifiable risk, unique risk, or asset- specific risk. For a well-diversified portfolio, the unsystematic risk is negligible; and essentially all of the risk is systematic. Total risk = Systematic risk + Unsystematic risk You can diversify some of the portfolio risk away by investing in investments with different levels of risk measured by a company s Beta. 19
5. Systematic Risk and Beta The Systematic Risk Principle The expected return on a risky asset depends only on that asset s systematic risk. The Beta Coefficient The amount of systematic risk present in a particular risky asset relative to that in an average risky asset. It is the measure of the average historic volatility of a security s return to the broader market risk and is stated as a proportion of the market risk. Beta for the whole market is deemed to be 1. A stock with a Beta of 1 is likely to move with the market. One with a Beta of 2 will move by twice the market in both directions. 20
6. Beta Coefficient for Selected Companies 21
Example 12.5 Total Risk and Beta Consider the following information about two securities: Standard deviation % Beta Security A 40 0.50 Security B 20 1.50 Which has greater total risk? A Which has greater unsystematic risk? A Which has greater systematic risk? B Which asset has a higher risk premium and expected return? B 22
5. Portfolio Betas P = wx x + wy y Portfolio beta Portfolio weight Company X s beta 23
Example 12.6 Portfolio Betas What is the expected return on this portfolio? What is the beta of this portfolio? Does this portfolio have more or less systematic risk than an average asset? 24
Example 12.6 Portfolio Betas We first have to calculate the portfolio weights. Notice that the total amount invested is 10,000. Of this, 1,000/10,000 = 10% is invested in Equity A. Similarly, 20% is invested in Equity B, 30 per cent is invested in Equity C, and 40 per cent is invested in Equity D. The expected return, E(RP), is thus: E(RP) = 0.10 x E(RA) + 0.20 x E(RB) + 0.30 x E(RC) + 0.40 x E(RD) = 0.10 x 8% + 0.20 x 12% + 0.30 x 15% + 0.40 x 18% = 14.9% Similarly, the portfolio beta, P, is: P= .10 x A+ .20 x B+ .30 x C+ .40 x D = 0.10 x 0.80 + 0.20 x 0.95 + 0.30 x 1.10 + 0.40 x 1.40 = 1.16 25
6. Beta and the Risk Premium Consider a portfolio made up of Asset A and a risk-free asset. We can calculate some different possible portfolio expected returns and betas by varying the percentages invested in these two assets. 26
Example Asset A has expected return E(RA) = 20% and beta = 1.6 Risk-free rate Rf is 8%, risk-free asset has beta = 0 Portfolio consists of Asset A and risk-free asset If 25% of portfolio invested in Asset A: E(RP) = 0.25 x E(RA) + 0.75 x Rf = 0.25 x 20% + 0.75 x 8% = 11% Portfolio beta = 0.25 x BA + 0.75 x 0 = 0.25 x 1.6 = 0.40 27
6. The Reward to Risk Ratio Gradient = ???? ??????? ???? 29
6. The Reward to Risk Ratio In equilibrium, the reward-to-risk ratio must be the same for all the assets in the market. E( ) E( ) R R R R A f B f = A B 30
7. The Reward to Risk Ratio 31
6. The Security Market Line A positively sloped straight line displaying the relationship between expected return and beta. 32
6. Market Risk Premium The slope of the SML the difference between the expected return on a market portfolio and the risk-free rate. 33
6. The Capital Asset Pricing Model (CAPM) The equation of the SML showing the relationship between expected return and beta. E(Ri) = Rf+ [E(RM) - Rf] x i Expected return of an asset in the market Expected return of the market portfolio Market risk premium Asset s beta 34
6. The Capital Asset Pricing Model The expected return for a particular asset depends on 3 things: The pure time value of money: As measured by the risk-free rate, Rf, this is the reward for merely waiting for your money, without taking any risk. The reward for bearing systematic risk: As measured by the market risk premium, E(RM) - Rf, this component is the reward the market offers for bearing an average amount of systematic risk in addition to waiting. The amount of systematic risk: As measured by i, this is the amount of systematic risk present in a particular asset or portfolio, relative to that in an average asset. 35
7. The Security Market Line 36
Example 12.8 Risk and Return Suppose the risk-free rate is 4% The market risk premium is 8.6% And a particular equity has a beta of 1.3 Based on the CAPM, what is the expected return on this equity? What would the expected return be if the beta were to double? 37
Example 12.8 Risk and Return With a beta of 1.3, the risk premium for the equity is 1.3 x 8.6% = 11.18% The risk-free rate is 4%, so the expected return is 15.18% (11.18 + 4) If the beta were to double to 2.6, the risk premium would double to 22.36%, so the expected return would be 26.36% (22.36 + 4). 38


")