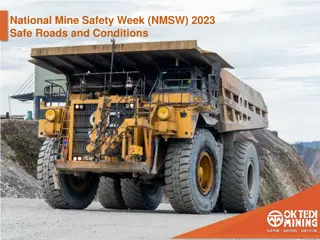
Road Accidents in India - 2016 Overview
The report provides a comprehensive analysis of road accidents in India in 2016, including statistics on fatalities, injuries, age groups of victims, and the distribution of accidents across different types of roads. It highlights the alarming number of accidents and casualties, emphasizing the need for improved road safety measures.

Download Presentation

Please find below an Image/Link to download the presentation.
The content on the website is provided AS IS for your information and personal use only. It may not be sold, licensed, or shared on other websites without obtaining consent from the author.If you encounter any issues during the download, it is possible that the publisher has removed the file from their server.
You are allowed to download the files provided on this website for personal or commercial use, subject to the condition that they are used lawfully. All files are the property of their respective owners.
The content on the website is provided AS IS for your information and personal use only. It may not be sold, licensed, or shared on other websites without obtaining consent from the author.
E N D
Presentation Transcript
ROAD ACCIDENTS IN INDIA - 2016 Government of India Ministry of Road Transport & Highways Transport Research Wing
Road Accidents -2016 The Report, Road Accidents in India -2016 contains information on various facets of road accidents in the States/U.Ts, Million Plus Cities and in the country as a whole for the calendar year 2016. Information collected from the Police Headquarters of the various States/UTs and Million Plus Cities through specific designated nodal officers (DGP/ADGP) Crime, ADGP (Traffic), Director (State Crime Record Bureau) in a 17-item format devised under Asia Pacific Road Accident Data (APARD) Format.
Road Accidents : A Snapshot Road Accidents - a leading cause of Injuries, Deaths & Disabilities. India : 2016 Accidents 4,80,652 Deaths 1,50,785 Person Injured 4,94,624 In Every Day : 1,317 Accidents take place and 413 Persons killed on Indian Roads In Every Hour: 55 Accidents take place and 17 Persons killed on Indian Roads
Road Accident Parameters and Change over the Previous Year Parameter 2016 % Change over previous year 2015 Total Accidents -4.1 5,01,423 4,80,652 Killed 3.2 1,46,133 1,50,785 Injured -1.1 5,00,279 4,94,624 Accident Severity* 7.9 29.1 31.4 *: Number of persons killed per 100 accidents
Age Group of Victims of Road Accidents - 2016 Age Group of less than 18 years accounted for a share of 7.0% (10,622 persons) in total accident fatalities. Youth of Age Group of 18-34 years accounted for the share of 46.3 % (69,851 persons) in total accident fatalities . Age Group of 18-45 years accounted for a share of 68.6 % (1,03,409 persons) in total accident fatalities. Working Age Group 18-60 years accounted for a share of 83.3 per cent ( 1,25,583 per sons) in the total road accident fatalities.
Percentage Share of Road Accidents, Person Killed and Injured on different type of Roads in 2016 Type of Road % Share of the Total Road Accidents % Share of the Total Person Killed % Share of the Total Person Injured National Highways 29.6 34.5 29.6 State Highways 25.3 27.9 25.8 Other Roads 45.1 37.6 44.6
86.5% of total number of Road Accidents accounted by 13 States (2016) Percentage Share of Top 13 States in Total Number of Road Accidents, 2016 Tamil Nadu Madhya Pradesh Karnataka Maharashtra Kerala Uttar Pradesh Andhra Pradesh Rajasthan Telangana Gujarat Chhattisgarh West Bengal Haryana 2.3 2.8 14.9 2.8 4.5 4.7 4.8 11.2 5.2 9.2 7.4 8.3 8.2
83.7% of total number of Persons Killed in Road Accidents accounted by 13 States(2016) Percentage Share of Top 13 States in Total Number of Persons Killed in Road Accidents, 2016 Uttar Pradesh Tamil Nadu Maharashtra Karnataka Rajasthan Madhya Pradesh Andhra Pradesh Gujarat Telangana West Bengal Punjab Haryana Bihar 3.3 3.3 12.8 3.4 4.3 4.8 11.4 5.4 5.7 8.6 6.4 7.4 6.9
87.8% of total number of Persons Injured in Road Accidents accounted by 13 States(2016) Percentage Share of Top 13 States in Total Number of Persons Injured in Road Accidents, 2016 Tamil Nadu Madhya Pradesh Karnataka Kerala Maharashtra Andhra Pradesh Uttar Pradesh Telengana Rajasthan Gujarat Chhattisgarh West Bengal Odisha 2.3 2.4 2.6 16.6 4.0 4.9 4.9 11.7 5.1 6.1 11.0 7.3 8.9
Share of Top 5 States (in percentage) in Total Number of Road Accidents & Fatalities: 2016 16 14.9 14 12.8 12 11.4 11.2 10 9.2 8.6 8.3 8 7.4 7.4 6.4 6 4 2 0 Tamil Nadu Madhya Pradesh Karnataka Maharashtra Uttar Pradesh % Share in Accidents % Share in Fatalities
Inter-City Comparison(2016) (50 cities with a million plus population) Million Plus Cities accounted for : 18.7 % of all Road Accidents. 11.8% of all Road Accident Fatalities. 16.7% of all Persons Injured in Road Accidents Chennai reported the highest number of Road Accidents 7,486 Delhi reported the highest number of Road Accident Deaths 1,591 Chennai reported the highest number of Persons Injured 7,349. Ludhiana had the highest Accident Severity i.e. 69.9.
Cities with Higher Road Accidents 2016 Five Cities with Higher Road Accidents Chennai 7486 Delhi 7375 Bangalore 5323 Indore 5143 Kolkata 4104 Mumbai 3379 0 1000 2000 3000 4000 5000 6000 7000 8000
Accidents based on the Age of Vehicles (in percentages) : 2016 45 40.3 40 35 32.7 30 25 20 15.4 15 9.4 10 5 2.2 0 Less than 5 year 5 - 10 Years 10 - 15 Years 15 Years & above Age not known
Accidents according to Vehicular Defect: 2016 Vehicular Defect No. of Accidents No. of Persons Killed No. of Persons Injured 20,690 Defective Brakes Defective Steering Punctured/ burst tyres Worn out tyres Other serious mechanical defect 19,695 5,609 6,736 2,185 7,117 5,258 1,811 5,258 3,084 1,327 3,370 61,495 20,148 62,942
Accidents according to Road conditions/ features: 2016 9,583 accidents occurred & resulted in killings of 3,396 people on Speed breakers. Potholes accounted for 6,424 Road Accidents & 2,324 fatalities. Maximum number of Road Accidents occurred on Two Lane Roads (1,90,800) followed by Single Lane (1,77,067) & Four Lane with Median (67,179).
Share in Total Road Accidents by Type of Motor Vehicle Involved : 2016 Non-motorized vehicles & other objects 4.5 Other Motor Vehicles 2.8 Trucks, Tempos, Tractors and other Articulated vehicles 21.0 Two-Wheelers 33.8 Buses 7.8 Auto- Rickshaws 6.5 Cars, Jeeps, Taxis 23.6
Accidents according Age of Drivers: 2016 Age Group No. of Accidents Fatal Accidents Total Accidents Less than 18 5,383 18,738 18-25 30,661 1,15,053 25-35 37,252 1,31,142 35-45 31,041 1,06,726 45-60 17,184 62,746 60 & Above 4,505 16,492 Age not known 10,045 29,755 Total 1,36,071 4,80,652
Accidents according to educational qualifications of Drivers: 2016 Educational Qualification of drivers No. of accidents Up to 8th Standard 89,936 Std. 8-10 1,49,795 Above Std.10 1,85,495 Qualification not known 54,998
Share of Total Number of Persons Killed in Road Accidents in terms of Road User Categories: 2016 Others* 2.0 Pedestrian 10.5 Other Motor Vehicles (including e-rickshaw) 10.6 Bicycles 1.7 Buses 6.6 Trucks 11.2 Two-wheelers 34.8 Cars, Taxis, Vans & LMVs 17.9 Auto- Rickshaws 4.7 * Includes: Animal Drawn Vehicles, Cycle Rickshaws, Hand Carts, Rickshaws and Other Persons
Vulnerable Road Users (2016) Most vulnerable Road Users killed on Road Accidents : Two Wheelers 52,500 (34.8%) Pedestrians 15,746 (10.5%) Bicycles 2, 528 (1.7) %
Type of Licence and Road Accidents: 2016 Holder of Regular Licence involved in more number of accidents 4,05,079 (84.6%). Holder of learners licence involved in 41,405 (8.7%) accidents and Persons without licence involved in 32,088 (6.7%) accidents. This implies requirement of proper evaluation/ testing of driving skill before the issue of licences.
Locations with Higher Accidents: 2016 Most accidents occurred: Open area - 1,88,196 Residential area - 63,031 Market Place - 31,431 Near Bus stand - 28,602 Pedestrian Crossing- 28,397 Near Educational - 27,723 Institutions
Multi-causal Nature of Road Accident Road combination of factors such as human error, road defects, manufacturing defects of vehicles; Accidents are Multi-causal- a Worsening environment especially traffic congestion raises the level of vulnerability; The number of vehicles increased at a CAGR of 9.8% whereas the total road length increased at a CAGR of 3.7% over 2005 to 2015.
Factors responsible for Road Accidents as reported by States/U.Ts : 2016 Accidents 4,03,598 (84.0) Killed 1,21,126 (80.3) Injured 4,14,785 (83.9) Fault of Driver of motor vehicle Fault of Driver of non-motorized vehicle Fault of Pedestrian Fault of Passenger Mechanical Defect in motor vehicle Engineering/ Designing fault of Roads Defect in road condition (surface of roads/surface condition of roads) Stray Animal Poor light condition Other causes Causes not known Total 6,546 (1.4) 2,250 (1.5) 7,620 (1.5) 8,298 (1.7) 5,200 (1.1) 6,688 (1.4) 3,091 (2.0) 2,181 (1.4) 2,823 (1.9) 7,465 (1.5) 4,535 (0.9) 6,956 (1.4) 1,289 (0.3) 589 (0.4) 1,217 (0.2) 7,158 (1.5) 2,983 (2.0) 6,579 (1.3) 1,604 (0.3) 3,833 (0.8) 20,858 (4.3) 15,580 (3.2) 4,80,652 629 (0.5) 1,631 (1.1) 7,312 (4.8) 6,170 (4.1) 1,50,785 1,307 (0.3) 4,477 (1.0) 23,380 (4.7) 16,303 (3.3) 4,94,624 Note: Figures in parenthesis are the percentage share
Drivers Fault- Main factor responsible for accidents: 2016 Drivers Fault revealed as a most responsible factor for Road Accidents - 84.0 % of total Road Accidents & 80.3 % of Road Accident Deaths. Within Drivers Fault : Over speeding of vehicles caused 66.5 % of Road Accidents & 61.0 % of Deaths Overtaking caused 7.3 % of Road Accidents & 7.8 % of Deaths . Intake of Alcohol/Drugs caused 3.7 % of Road Accidents & 5.1% of Deaths. Act of talking over Mobile Phones resulted in 4976 accidents and 2138 deaths and 4746 injuries.
Responsibilities of Drivers: 2016 Responsibilities of Drivers Accidents Killed Injured Exceeding lawful speed 2,68,341 (66.5) 73,896 (61.0) 2,82,870 (68.2) Intake of Alcohol 14,894 (3.7) 6,131 (5.1) 11,648 (2.9) Jumping Red Light 4,491 (1.1) 1,260 (1.0) 4,636 (1.1) Driving on Wrong Side 17,654 (4.4) 5,705 (4.7) 17,908 (4.3) Jumping/ Changing lanes 8,513 (2.1) 2,795 (2.3) 8,177 (2.0) Overtaking 29,647 (7.3) 9,462 (7.8) 29,171 (7.0) Using of Mobile phones during driving 4,976 (1.2) 2,138 (1.8) 4,746 (1.1) Asleep or fatigued or sick 4,552 (1.1) 1,796 (1.5) 4,685 (1.1) Other improper actions 50,530 (12.6) 17,943 (14.8) 50,944 (12.3) Note: Figures in parenthesis are the percentage share
Other Parameters of Road Accidents: 2016 Vehicular Load condition caused : 61, 325 (12.8%) of total Road Accidents & 21,302 (14.1%) of Deaths. Head on collision : 96,466 (20.1%) of total Road Accidents & 27,446 (18.2%) of Deaths. Hit & Run Cases : 55,942 (11.6%) of total Road Accidents & 22,962 (15.2%) of Deaths.
Accidents at Junctions: 2016 About 37 % of total Road Accidents occurred junctions. Within junctions accidents occurred at uncontrolled junctions. on the 72.9% of
Use of Safety Devices: 2016 Out of total of 52,500 two wheeler riders in Road accidents, 10,135 two wheeler riders (19.3%) reported to be not wearing Helmets. Non-wearing of Seat-belts resulted in 5,638 deaths (3.7%) in Road Accidents.
Improving Road Accident Database Road Accidents are multi-causal, but falls into three broad categories, viz., - Human error - Road engineering defects - Vehicular defects Need to focus on vulnerable road users, especially pedestrians; A committee consisting of expert members from IITs, State Police etc. constituted by the Ministry to move closer towards an accurate, consistent and objective road accident database.
Improving Road Accident Database (contd.) The Committee recommended a uniform accidents recording format for the State/UT Police; and corresponding annual accident data reporting formats. The new Recording Format developed to make it simple for the police to understand and to cover all relevant information relating to road accident accident identification/location, road conditions, vehicles involved and details of road accident victims. The new formats to foster objectivity in data recording by capturing the circumstances under which an accident occurred, adequate capturing of impacting vehicles details and improve accuracy in pedestrian victims. MoRTH has accorded approval to the new formats and disseminated to States/UTs. Approved formats uploaded in the Ministry s website (www.morth.nic.in). Familiarization workshops; one national level at IIT-Delhi and five zonal levels each at IIT-Bombay, IIT-Guwahati, IIT-Kanpur, IIT-Kharagpur and IIT-Madras organised for State & UT Police officers.
Government Initiatives The Government has been implementing multi-pronged road safety programmes and initiatives which encompasses mass awareness/ education engineering measures (both road and vehicle), enforcement of safety laws and emergency care to road accident victims. programmes,
Recent Measures taken by MoRTH i. Road Engineering measures: 789 black spots identified of which 651 on NH and 138 on State roads. 140 spots already rectified. 283 under process. Road Safety Audits at different stages are integral part of BOT and EPC road projects. All road development provision for essential road safety furniture: like road signs, markings, delineators etc. Crash barriers installed in hilly areas. projects have
Recent Measures taken by MoRTH (contd.) ii. Vehicular safety standards and IT enabled safety measure Trucks prohibited from carrying protruding roads; Anti-locking Brake System (ABS) made mandatory on Heavy Vehicles. Cars to have provision for fitment of at-least one child seat. AHO (Automatic mandatory for Two Wheelers. Bus and truck code for safe cabins for drivers and others. Headlight On) made
Recent Measures taken by MoRTH (contd.) iii. Education and Awareness Ministry sanctioned 24 model institutes of drivers training and research (IDTR) for drivers. Of which 16 functional. Road Safety Week observed each year for mass awareness. To support traffic and transport rules.
Recent Measures taken by MoRTH (contd.) iv. Post-crash response and trauma care Good Samaritans Supreme Court States/U.Ts requested to implement. NHAI provide ambulances at a distance of 50-60 kms on completed stretches of NH. MV Amemdment Bill 2017 provide stricter penalities for traffic offences for strengthening enforcement and ensuring compliance: Drunk driving Overloading Overspeeding Red light jumping guidelines accepted by
Always Follow Road Safety Rules Thank you


 in Total")
")


")


")
")
")