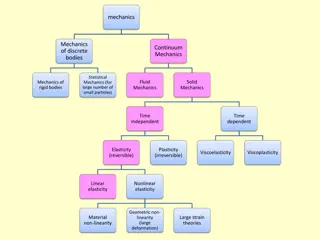
Rock Mechanics and Hooke's Law Fundamentals
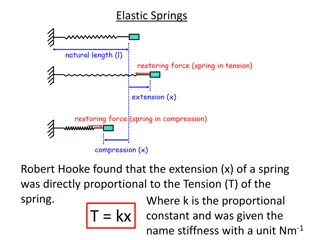
Explore the principles of Rock Mechanics and Hooke's Law, focusing on stress-strain relations and equilibrium states of linear springs. Understand the linear behavior of springs under different forces and displacements through graphical representations. Dive into the foundational concepts presented by Professor Dr. Hamed M. Jassim at Tishk International University.

Download Presentation

Please find below an Image/Link to download the presentation.
The content on the website is provided AS IS for your information and personal use only. It may not be sold, licensed, or shared on other websites without obtaining consent from the author.If you encounter any issues during the download, it is possible that the publisher has removed the file from their server.
You are allowed to download the files provided on this website for personal or commercial use, subject to the condition that they are used lawfully. All files are the property of their respective owners.
The content on the website is provided AS IS for your information and personal use only. It may not be sold, licensed, or shared on other websites without obtaining consent from the author.
E N D
Presentation Transcript
Testing the Impact of Specificity on Human Interpretations of State Uncertainty P R E S E N T E D B Y Laura Matzen (PI) Brie Howell & Michael Trumbo Sandia National Laboratories is a multimission laboratory managed and operated by National Technology and Engineering Solutions of Sandia LLC, a wholly owned subsidiary of Honeywell International Inc. for the U.S. Department of Energy s National Nuclear Security Administration under contract DE-NA0003525. SAND2022-9130 O
Specificity in Visualizations of State Uncertainty State uncertainty is uncertainty about the current or future state of some phenomenon - Very common in AI and machine learning outputs Humans are notoriously bad at understanding state uncertainty - We know very little about how different representations of state uncertainty impact human decisions - But we know that they do! https://ai.googleblog.com/2022/04/locked-image-tuning-adding-language.html
Hints and Gaps in the Prior Literature Three prior studies suggest that more specific information about uncertainty produces more risk-averse decisions 40-60% chance vs. 40-50% chance Bisantz et al., 2011 Bisantz, Marsigilio & Munch, 2005 Patterns of decision making changed when people saw visualizations of uncertainty instead of numeric or linguistic expressions Cheong et al., 2016 People seem to treat visual cues as having higher levels of specificity than numeric or linguistic expressions If this is a consistent effect, we need to be aware of it when d
Wildfire Evacuation Task Show people the probability that their house will burn down in a wildfire. Ask them if they will stay or evacuate. Evacuation costs money, staying in a house that burns down costs money, participants receive a real money based on their decisions Does increasing specificity of the representation change their decision threshold (does it make them more risk-averse?) Do we get the same effect when we compare visual representations to numeric ones? Does visualizing the info increase the apparent specificity? Increasing Specificity (icon type) Increasing Specificity (number of probability bands) encodings of uncertainty Increasing Specificity Different visual (icon number) Will also test isarithmic maps and hue maps with a value suppressing uncertainty palette Increasing specificity? Numeric Visual?
Icon Array Experiment Widely used to support risk communication in medical decision making Useful for helping people understand probability, especially people with lower numeracy skills Increasing the specificity of icon arrays: Increase the number of icons (10 vs 100) to give more precise percentages Manipulations that might increase the perceived specificity of icon arrays: Iconicity Randomization of icons
Results 50% probability Proportion of Participants Choosing to Evacuate from an (Imaginary) Wildfire 0.9 0.8 0.7 0.6 0.5 0.4 0.3 0.2 0.1 0 Numerical Representations Simple Visual Representation (Basic Icon Array) Visual Representation with Increased Iconicity Visual Representation Emphasizing Randomness of Outcome
Results: People were more likely to evacuate when show icon arrays than when shown natural frequencies People more likely to evacuate when shown houses than when shown squares People more likely to evacuate when shown randomized icons than when shown ordered icons No differences for different numbers of icons
Results The way in which state uncertainty is represented impacts decision making More specific representations (i.e. 61 out of 100 instead of 6 out of 10 ) tend to produce more risk-averse decisions Visualizing uncertain information produces more risk-averse decisions than numerical representations with the same level of specificity People seem to interpret visualizations as if they are more specific than other types of representations The specifics of the visual encoding also matter Visual design choices can increase the perceived specificity of the visualization, which makes people even more risk averse
x x x x x x x x x x x x
Map Experiment Results Three Probability Ranges 1 0.9 0.8 0.7 0.6 0.5 0.4 0.3 0.2 0.1 0 10-40% 40-70% 70-100% Hue Hue Uncert Palette Isarithmic Transparency Nat Freq
Map Experiment Results Six Probability Ranges 1 0.9 0.8 0.7 0.6 0.5 0.4 0.3 0.2 0.1 0 10-25% 25-40% 40-55% 55-70% 70-85% 85-100% Hue Hue Uncert Palette Isarithmic Transparency Nat Freq
Map Experiment Results Nine Probability Ranges 1 0.9 0.8 0.7 0.6 0.5 0.4 0.3 0.2 0.1 0 10-20% 20-30% 30-40% 40-50% 50-60% 60-70% 70-80% 80-90% 90-100% Hue Hue Uncert Palette Isarithmic Transparency Nat Freq
Conclusions We need to be aware of this when presenting the outputs of AI applications to people. Different representations may not be equivalent from the perspective of human comprehension and decision making If we ignore this pattern, we may unintentionally introduce biases in decision making
What if we actually make the 100 icon arrays more specific?
Individual Differences Objective Numeracy Scale Subjective Numeracy Scale Short Graph Literacy Scale Risk Propensity Scale Need for Cognition
Current CIS LDRD (1 year) Increasing Specificity 1.00 0.90 0.80 Decision to Evacuate 0.70 0.60 0.50 0.40 0.30 0.20 0.10 0.00 10% 20% 30% 40% 50% 60% 70% 80% 90% Probability that house will be in the burn zone Optimal Numerical 10 Squares 10 Houses 100 Houses
1.00 1.00 1.00 0.90 0.90 0.90 0.80 0.80 0.80 0.70 0.70 0.70 0.60 0.60 0.60 0.50 0.50 0.50 0.40 0.40 0.40 0.30 0.30 0.30 0.20 0.20 0.20 0.10 0.10 0.10 0.00 0.00 0.00 10% 20% 30% 40% 50% 60% 70% 80% 90% 10% 20% 30% 40% 50% 60% 70% 80% 90% 10% 20% 30% 40% 50% 60% 70% 80% 90% Optimal Squares Ordered 10 Squares Random 10 Optimal Houses Ordered 10 Houses Random 10 Optimal Squares Ordered 10 Squares Random 10 Houses Ordered 10 Houses Random 10 1.00 1.00 1.00 0.90 0.90 0.90 0.80 0.80 0.80 0.70 0.70 0.70 0.60 0.60 0.60 0.50 0.50 0.50 0.40 0.40 0.40 0.30 0.30 0.30 0.20 0.20 0.20 0.10 0.10 0.10 0.00 0.00 0.00 10% 20% 30% 40% 50% 60% 70% 80% 90% 10% 20% 30% 40% 50% 60% 70% 80% 90% 10% 20% 30% 40% 50% 60% 70% 80% 90% Optimal Squares Ordered 100 Squares Random 100 Optimal Houses Ordered 100 Houses Random 100 Optimal Squares Ordered 100 Squares Random 100 Houses Ordered 100 Houses Random 100


")