Role of Environmental Communication in Delhi's Air Quality Policy
Explore the impact of environmental communication on air quality management policy in Delhi, analyzing the interplay between media coverage, public opinion, and policy outcomes. The study sheds light on how communication can drive awareness, policy changes, and public engagement in combating air pollution.
Download Presentation

Please find below an Image/Link to download the presentation.
The content on the website is provided AS IS for your information and personal use only. It may not be sold, licensed, or shared on other websites without obtaining consent from the author. If you encounter any issues during the download, it is possible that the publisher has removed the file from their server.
You are allowed to download the files provided on this website for personal or commercial use, subject to the condition that they are used lawfully. All files are the property of their respective owners.
The content on the website is provided AS IS for your information and personal use only. It may not be sold, licensed, or shared on other websites without obtaining consent from the author.
E N D
Presentation Transcript
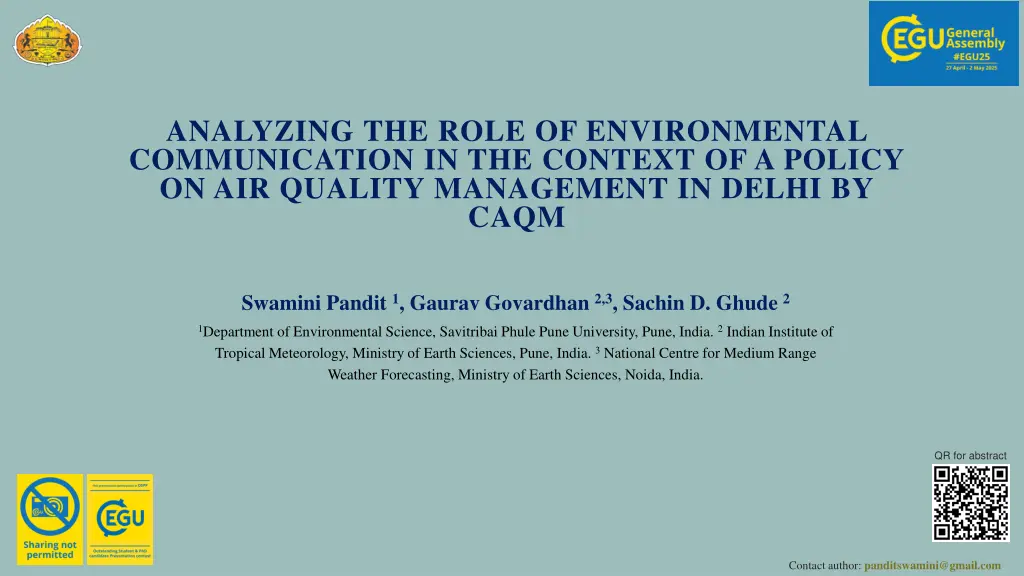
ANALYZING THE ROLE OF ENVIRONMENTAL COMMUNICATION IN THE CONTEXT OF A POLICY ON AIR QUALITY MANAGEMENT IN DELHI BY CAQM Swamini Pandit 1, Gaurav Govardhan 2,3, Sachin D. Ghude 2 1Department of Environmental Science, Savitribai Phule Pune University, Pune, India.2Indian Institute of Tropical Meteorology, Ministry of Earth Sciences, Pune, India.3National Centre for Medium Range Weather Forecasting, Ministry of Earth Sciences, Noida, India. QR for abstract Contact author: panditswamini@gmail.com
WHY DELHI AIR POLLUTION AND ENVIRONMENTAL COMMUNICATION? Environmental communication is crucial- To draw public and political attention to environmental problems and work as a catalyst in making new policies. To act as a bridge between scientists and the general public, distilling complex facts into actionable information. role in shaping public opinion and setting agendas for clean air PROBABLEINTER-RELATIONSHIP Citizens (Air pollution sufferers) Media Media Delhi, India s capital- Often tops the list of the most polluted cities globally. Along with NCR show very high AQI during post- monsoon and winters posing greater health risks and economical loss due to lack of productivity. Has a comprehensive policy to curb air pollution since July 2022 by CAQM. Solution and Results Governance
ACTION PLAN AND METHOD TO ANALYSE THE RELATION BETWEEN INDIAN MEDIA COVERAGE AND POLICY TO CURB AIR POLLUTION IN DELHI Time period of 6 months (1st September 2021 to 31st March 2022) News articles from print and online versions from the official websites 4 news channels & 4 newspapers Identifying media agencies Keywords: Delhi air pollution , Air pollution in Delhi , Air quality index and Delhi air pollution and health Results obtained are compared with fire count during this period and interpreted with the help of charts Total news analysed- 277 based on 20 parameters CAQM policy is understood Conclusion drawn
Results TOTAL MONTH-WISE NEWS COVERAGE BY MEDIA Total Distribution News channels and Papers 1% 1% 1%5% ABP 9% Jan 2022 24% BBC India 19% 11% 2% 2% Feb 2022 Hindustan Times Mar 2022 42% 4% INDIA TV News channel Sep 2021 News paper Indian Express Oct 2021 30% 58% 17% Nov 2021 NDTV Dec 2021 The Hindu 17% 57% TOI Total news coverage Temporal variation in news coverage 12 120 10 100 Number of news 8 80 Number of news 6 News channel 60 News channel 4 News paper News paper 40 2 20 0 01-09-2021 09-09-2021 29-09-2021 05-10-2021 09-10-2021 18-10-2021 25-10-2021 01-11-2021 06-11-2021 10-11-2021 14-11-2021 18-11-2021 22-11-2021 26-11-2021 01-12-2021 05-12-2021 09-12-2021 14-12-2021 19-12-2021 31-12-2021 15-01-2022 08-03-2022 0 Sep Oct Nov Dec Jan Feb Mar Dates 2021 2022
Fire count, AQI and News coverage Pollution causing sources by media 140 Number of news in which the source is mentioned 124 Max AQI Fire count News Stuble burning 120 2500 20 Brick kilns 18 96 Transport 100 88 2000 16 Fire Crackles 75 14 FIRE COUNT AND AQI 80 Geographical location of Delhi Physical reasoning NEWS COUNT 1500 12 60 10 50 46 Contruction & Demolition Other sources 1000 8 40 6 500 4 20 10 4 2 0 0 0 Sources contributing to Delhi air pollution as per media coverage 9/1/2021 10/1/2021 11/1/2021 12/1/2021 1/1/2022 2/1/2022 3/1/2022 Existing policy and Recommended policy Total news and 'health' covered by media Total News News mentioning Health Count of Existing Policy mentioned Count of Policy recommendation 25 20 20 18 16 Count of News 15 14 Count of news 12 10 10 8 5 6 4 0 01-09-2021 08-09-2021 21-09-2021 30-09-2021 05-10-2021 08-10-2021 14-10-2021 19-10-2021 25-10-2021 30-10-2021 04-11-2021 07-11-2021 10-11-2021 13-11-2021 16-11-2021 19-11-2021 22-11-2021 25-11-2021 28-11-2021 02-12-2021 05-12-2021 08-12-2021 12-12-2021 15-12-2021 19-12-2021 25-12-2021 09-01-2022 04-02-2022 08-03-2022 2 0 9/1/2021 10/1/2021 11/1/2021 12/1/2021 1/1/2022 2/1/2022 3/1/2022
Recommendation to public Public Recommendation Vs Policy Recommendation Vs policy Mentioned News To reduce health impacts To reduce the extent of pollution 20 Total Public Recommendation Existing Policy mentioned Policy recommendation 18 14 16 12 14 Count of News 12 10 Count of News 10 8 8 6 6 4 4 2 2 0 9/1/2021 10/1/2021 11/1/2021 12/1/2021 1/1/2022 2/1/2022 3/1/2022 0 9/1/2021 10/1/2021 11/1/2021 12/1/2021 1/1/2022 2/1/2022 3/1/2022 Mention of the 'Economy' in the news articles CONCLUSIONS AND KEY FINDINGS Media Coverage Trends: o News channels (58%) report Delhi s air pollution more frequently than newspapers (42%). o Reporting is seasonal & event-driven peaking in November (57%) due to stubble burning in Punjab & Haryana. o Policy & public recommendations also spike during this period. Media & CAQM Policy Link: o Minimal direct influence of media coverage on CAQM s July 2022 policy. o Health issues underreported only 56 of 277 articles focus on health, though CAQM aims to reduce pollution. Media vs Pollution Metrics: o Strong correlation between news articles & active fire count. o 68% of news coverage in Oct Nov aligns with peak stubble-burning phases. o No proportional increase in coverage during high AQI levels showing media s focus on seasonal emissions rather than overall pollution trends. o CAQM treats stubble burning as just another source, without special focus in policy. 5 4 Economical loss due to Govt. Interventions for pollution control Count of news 3 Economical loss due to poor AQI 2 1 0
ACKNOWLEDGEMENTS REFERENCES Commission for Air Quality Management in National Capital Region and Adjoining Areas, [Online]. Available: https://caqm.nic.in/Index1.aspx?lid=17&lsid=11&pid=1&lev=2&langid= 1. We would like to thank the NASA FIRMS for providing the VIIRS active fire data set and CPCB for providing the measured PM2.5 data across the city of Policy to Curb Air Pollution in the National Capital Region, July 2022. [Online]. Available: chrome- extension://efaidnbmnnnibpcajpcglclefindmkaj/https://caqm.nic.in/WriteR eadData/LINKS/0031dcb806e-8af7-4b38-a9bc-65b91f2704cd.pdf. Delhi. We would also like to thank the media agencies for sharing the required data for this study. We also A. Hansen, Environment, media and communication looking back, looking forward, in Environment, media and communication, Routledge, 2018, p. 14. wish to acknowledge Mr. Manish Joshi for his technical help during the analysis of data. Ambient air pollution: A global assessment of exposure and burden of disease., World Health Organisation - Clean Air Journal, 26 (2), pp. 6-6, 2016. Murukutla et al., Online media coverage of air pollution risks and current policies in India: A content analysis., WHO South East Asia J Public Health., no. 6(2), pp. 41-50, September 2017. Thank You!


