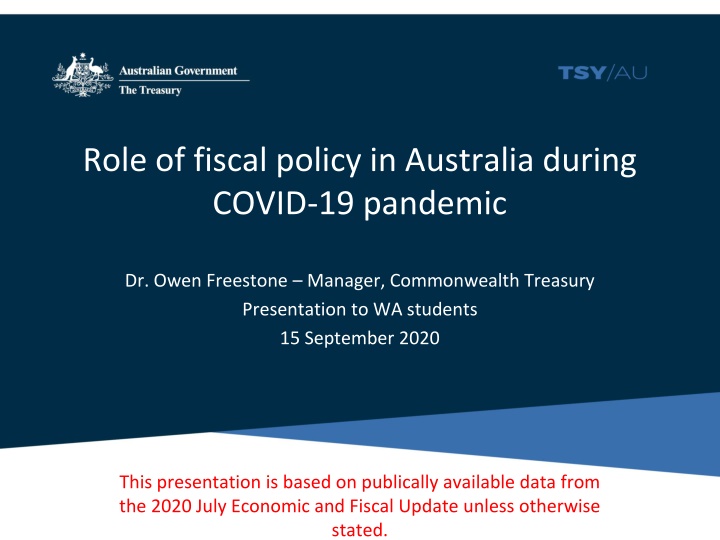
Role of Fiscal Policy in Australia during COVID-19 Pandemic
Fiscal policy in Australia during the COVID-19 pandemic involved setting government taxes and expenditure to ensure stable and sustainable economic growth. Various approaches such as stabilisation, redistribution, and allocation were utilized, including automatic stabilisers and discretionary measures to support the economy.

Download Presentation

Please find below an Image/Link to download the presentation.
The content on the website is provided AS IS for your information and personal use only. It may not be sold, licensed, or shared on other websites without obtaining consent from the author.If you encounter any issues during the download, it is possible that the publisher has removed the file from their server.
You are allowed to download the files provided on this website for personal or commercial use, subject to the condition that they are used lawfully. All files are the property of their respective owners.
The content on the website is provided AS IS for your information and personal use only. It may not be sold, licensed, or shared on other websites without obtaining consent from the author.
E N D
Presentation Transcript
Role of fiscal policy in Australia during COVID-19 pandemic Dr. Owen Freestone Manager, Commonwealth Treasury Presentation to WA students 15 September 2020 This presentation is based on publically available data from the 2020 July Economic and Fiscal Update unless otherwise stated.
What is fiscal policy? Fiscal policy involves setting government taxes and expenditure. The aim of fiscal policy is stable and sustainable economic growth. There are multiple ways to meet this aim: Stabilisation macro management Redistribution fairness Allocation economic efficiency 2
Stabilisation function Smooth short-term economic fluctuations Intersects with monetary policy, and more recently macro-prudential policy Australian counter-cyclical fiscal policy takes a couple of forms: Automatic stabilisers (dominant approach) Rule based, non-discretionary, passive changes to fiscal outcomes: welfare payments (unemployment), progressive taxes Discretionary Active, (typically) temporary changes: tax holidays, tax cuts, transfers (cash payments) or other spending 3
Stabilising the business cycle Real GDP peak Macroeconomic stabilisers tempering output negative output gap trough positive output gap Macroeconomic stabiliser supportingoutput Time 4
Role of monetary and fiscal policy Note: Underlying cash balance is shown as a share of GDP. Grey shading represents the 1990s recession, the Global Financial Crisis and COVID- 19. This shading covers dates from Jun-91 to Dec-92 (when unemployment peaked), Sept-08 to Sept-09, and Mar-20 to Dec-20. Forecasts from July Economic and Fiscal Update. Source: Treasury. 5
Global active cases (as at 15 September 2020) Source: John Hopkins Coronavirus Resource Center, Treasury. 6
Global daily confirmed cases and deaths (as at 15 September) Confirmed cases ('000) Confirmed cases ('000) Confirmed deaths ('000) Confirmed deaths ('000) 350 350 12 12 300 300 10 10 250 250 8 8 200 200 6 6 150 150 4 4 100 100 2 2 50 50 0 0 0 0 Jan-2020 Mar-2020 May-2020 Jul-2020 Jan-2020 Mar-2020 May-2020 Jul-2020 Source: John Hopkins Coronavirus Resource Center, Treasury. 7
Fiscal measures by category over time (impact on underlying cash balance) $billion $billion 70 70 60 60 2019-20 50 50 2020-21 40 40 30 30 20 20 10 10 0 0 JobKeeper Payment Boosting cash flow for employers Income support for individuals Payments to support households Investment tax incentives Other Source: July Economic and Fiscal Update. Note: The coronavirus measures in this chart only include economic measures. Health measure are not included. 8
Direct fiscal multiplier ??? ($) ?????? ???? ($) ??? ?????????? = ??? ?????????? = ??? (1 ?????? ???????) ???????? ?????????? ?? ??????? (???) = ???????? ($) ?????? ($) 9
Real GDP before and after economic support $billion $billion 500 500 (f) After economic support 480 480 460 460 Before economic support 440 440 420 420 Jun-15 Jun-16 Jun-17 Jun-18 Jun-19 Jun-20 Jun-21 Source: ABS cat. no. 5206.0 and Treasury. Note: Forecasts from July Economic and Fiscal Update. 10
Unemployment rate before and after economic support 16 Per cent Per cent 16 (f) 12 12 Before economic support 8 8 4 4 After economic support 0 Jun-15 0 Jun-16 Jun-17 Jun-18 Jun-19 Jun-20 Jun-21 Source: ABS cat. no. 6202.0 and Treasury. Note: Forecasts from July Economic and Fiscal Update. 11
Discretionary and automatic fiscal response (new measures versus automatic changes in receipts and payments) Source: July Economic and Fiscal Update. Note: The coronavirus measures in this chart include health measures. Data from July Economic and Fiscal Update. 12
International real GDP growth comparisons (Six months to June quarter 2020) Per cent Per cent 5 5 0 0 -5 -5 -10 -10 -15 -15 -20 -20 -25 -25 Q1 Q2 Source: Treasury and national statistical agencies. 13
Contributions to real GDP growth (June quarter 2020) Percentage points, qoq Percentage points, qoq 6.0 6.0 4.0 4.0 Household Consumption -6.7 2.0 2.0 New Public Final Demand 0.5 Net Exports 1.0 GDP -7.0 0.0 0.0 New Business Investment -0.4 Dwelling Investment -0.4 Change in Inventories -0.6 -2.0 -2.0 -4.0 -4.0 -6.0 -6.0 -8.0 -8.0 Source: ABS cat. no. 5206.0 and Treasury. Note: The sum of individual components may not add to the aggregate due to rounding and the omission of the statistical discrepancy. 14
Consumption by category (June quarter 2020) -100 -80 -60 -40 -20 0 20 Alcoholic beverages Furnishings and household equipment Electricity, gas and other fuel Goods Communications Services Insurance and other financial services Mixed components Rent and other dwelling services Education services Food Cigarettes and tobacco Recreation and culture Purchase of vehicles Clothing and footwear Health Operation of vehicles Other goods and services Hotels, cafes and restaurants Per cent, qoq Transport services -100 -80 -60 -40 -20 0 20 Source: ABS cat. no. 5206.0 and Treasury. 15
International gross debt comparison Per cent of GDP Per cent of GDP 160 160 (f) GFC 140 140 120 120 100 100 80 80 60 60 40 40 20 20 0 0 2000 2003 2006 2009 2012 2015 2018 2021 Australia Advanced economies Source: IMF World Economic Outlook Update June 2020 and Treasury. Note: Data from IMF. General government gross debt includes central, state, territory and local governments. 16
Role of fiscal policy in Australia during COVID-19 pandemic Dr. Owen Freestone Manager, Commonwealth Treasury Presentation to WA students 15 September 2020 This presentation is based on publically available data from the 2020 July Economic and Fiscal Update unless otherwise stated.