Role of Income and Substitution in Industrial Commodity Demand
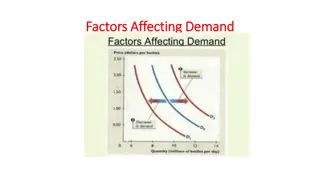
Investigate the impact of income and substitution on industrial commodity demand through global energy and metal consumption trends, energy intensity paths, and China's significant influence. Analyze the declining oil and energy intensity of GDP and China's dominance in metal consumption to understand the evolving dynamics of the industrial sector.

Download Presentation

Please find below an Image/Link to download the presentation.
The content on the website is provided AS IS for your information and personal use only. It may not be sold, licensed, or shared on other websites without obtaining consent from the author.If you encounter any issues during the download, it is possible that the publisher has removed the file from their server.
You are allowed to download the files provided on this website for personal or commercial use, subject to the condition that they are used lawfully. All files are the property of their respective owners.
The content on the website is provided AS IS for your information and personal use only. It may not be sold, licensed, or shared on other websites without obtaining consent from the author.
E N D
Presentation Transcript
The Role of Income and Substitution in Industrial Commodity Demand
Outline 2
Outline 3
Global energy consumption Barrels of oil per day equivalent 100 Crude oil Natural gas 80 Coal Renewables 60 40 20 0 1965 1970 1975 1980 1985 1990 1995 2000 2005 2010 2015 Source: BP Statistical Review and World Bank.
Global aluminum, copper, and zinc consumption Million tons 60 50 Aluminum 40 30 Copper 20 Zinc 10 0 1965 1970 1975 1980 1985 1990 1995 2000 2005 2010 2015 Source: World Bureau of Metal Statistics and World Bank
Energy and metal intensity paths have diverged Index, 1965 = 100 120 Metals, world Energy, world 110 100 90 80 70 60 50 1965 1970 1975 1980 1985 1990 1995 2000 2005 2010 2015 Source: BP Statistical Review, World Bureau of Metal Statistics, and World Bank. 6
China has been driving the divergence Index, 1965 = 100 Index, 1965 = 100 120 120 Metals, world Energy, world Metals, world Energy, world Metals, world ex. China Energy, world ex. China 110 110 100 100 90 90 80 80 70 70 60 60 50 50 1965 1970 1975 1980 1985 1990 1995 2000 2005 2010 2015 1965 1970 1975 1980 1985 1990 1995 2000 2005 2010 2015 Source: BP Statistical Review, World Bureau of Metal Statistics, and World Bank. 7
Oil and energy intensity of GDP have been declining Oil Energy Barrels of oil per $10,000 of GDP Barrels of oil equivalent per $10,000 of GDP 14 35 World OECD Non-OECD World OECD Non-OECD 12 30 10 25 8 20 6 15 4 10 2 5 1965 1970 1975 1980 1985 1990 1995 2000 2005 2010 2015 1965 1970 1975 1980 1985 1990 1995 2000 2005 2010 2015 Source: BP Statistical Review and World Bank. 8
China dominates metal consumption Million metric tons 16 Rest of the world 12 8 China 4 0 1995Q1 1997Q1 1999Q1 2001Q1 2003Q1 2005Q1 2007Q1 2009Q1 2011Q1 2013Q1 2015Q1 2017Q1 Source: World Bank and World Bureau of Metal Statistics Notes: Last observation is 2018Q4. 9
Energy: per capita consumption and income, 1965-2017 Coal Oil Barrels of oil per capita equivalent Barrels of oil per capita 15 25 12 20 9 15 6 10 5 3 G7 China Korea, Rep. G7 China Korea, Rep. 0 0 0 10 20 30 40 GDP per capita, 000 50 0 10 20 30 40 50 GDP per capita, 000 Natural gas Energy Barrels of oil per capita equivalent 50 12 40 9 30 6 20 3 10 G7 China Korea, Rep. G7 China Korea, Rep. 0 0 0 10 20 30 40 50 0 10 20 30 40 50 GDP per capita, 000 GDP per capita, 000 Source: BP Statistical Review, International Energy Agency, World Bank 10
Metals: per capita consumption and income, 1965-2017 Zinc Aluminum Kg per capita 15 Kg per capita 30 12 20 9 6 10 3 G7 China Korea, Rep. G7 China Korea, Rep. 0 0 0 10 20 30 40 GDP per capita, 000 50 0 10 20 30 40 GDP per capita, 000 50 Copper Base metals Kg per capita Kg per capita 25 80 60 20 15 40 10 20 5 G7 China Korea, Rep. G7 China Korea, Rep. 0 0 0 10 20 30 40 GDP per capita, 000 50 0 10 20 30 40 50 GDP per capita, 000 Source: World Bank, World Bureau of Metal Statistics 11
Oil consumption mb/d 60 OECD, actual Non-OECD, actual 50 40 30 20 1980 1982 1984 1986 1988 1990 1992 1994 1996 1998 2000 2002 2004 2006 2008 2010 2012 2014 2016 2018 2020 Source: International Energy Agency and World Bank. Note: The projection was taken from the 2005 IEA WorldEnergy Outlook. 12
Oil consumption and prospects as envisaged in 2005 mb/d 60 OECD, actual Non-OECD, actual OECD, projected in 2005 Non-OECD, projected in 2005 50 40 30 20 1980 1982 1984 1986 1988 1990 1992 1994 1996 1998 2000 2002 2004 2006 2008 2010 2012 2014 2016 2018 2020 Source: International Energy Agency and World Bank. Note: The projection was taken from the 2005 IEA WorldEnergy Outlook. 13
Commodity consumption: Share of China 12.5 Crude oil 3.7 50.5 Coal 24.8 49.4 Iron ore 8.6 50.4 Base metals 5.7 21.8 Grains 22.6 22.2 Edible oils 11.3 18.7 Population 2014-16 21.4 1990-92 12.0 GDP 2.4 - 15 30 45 60 Share of world total (percent) Source: World Bank, BP Statistical Review of World Energy, World Bureau of Metals Statistics, U.S. Department of Agriculture 14
Commodity consumption: Shares of China and India China India 12.5 4.4 Crude oil Crude oil 3.7 1.9 50.5 10.5 Coal Coal 24.8 5.2 49.4 5.4 Iron ore Iron ore 8.6 1.9 50.4 3.0 Base metals Base metals 5.7 1.8 21.8 9.7 Grains Grains 22.6 9.9 22.2 13.5 Edible oils Edible oils 11.3 9.3 18.7 17.8 Population Population 2014-16 2014-16 21.4 16.5 1990-92 1990-92 12.0 3.0 GDP GDP 2.4 1.2 - 15 30 45 60 - 15 30 45 60 Share of world total (percent) Share of world total (percent) Source: World Bank, BP Statistical Review of World Energy, World Bureau of Metals Statistics, U.S. Department of Agriculture 15
Copper consumption: China Share of global consumption, 3-year moving average 0.7 0.6 0.5 0.4 0.3 0.2 0.1 0.0 1800 1815 1830 1845 1860 1875 1890 1905 1920 1935 1950 1965 1980 1995 2010 Source: Abstract of British Historical Statistics, Bureau of Mines Minerals Yearbook, Lemon (1838), Mineral Statistics of the British Empire and Foreign Countries, Statistical Summary of the Minerals Industry, Schmitz (1979), Stuermer (2017), Symons (2003), The Copper Handbook, World Bureau of Metal Statistics. Notes: The data set for this figure was compiled by Wee Chain Koh. 16
Copper consumption: UK, U.S. and China Share of global consumption, 3-year moving average 0.7 0.6 0.5 China 0.4 United Kingdom United States 0.3 0.2 0.1 0.0 1800 1815 1830 1845 1860 1875 1890 1905 1920 1935 1950 1965 1980 1995 2010 Source: Abstract of British Historical Statistics, Bureau of Mines Minerals Yearbook, Lemon (1838), Mineral Statistics of the British Empire and Foreign Countries, Statistical Summary of the Minerals Industry, Schmitz (1979), Stuermer (2017), Symons (2003), The Copper Handbook, World Bureau of Metal Statistics. Notes: The data set for this figure was compiled by Wee Chain Koh. 17
Outline 18
A demand model ??: Per capita commodity consumption at year t ??: Real per capita income ?? ??: Real price of the commodity ??: 1 vector of control variables, such as fixed effects, cross-price impacts, and various country-specific characteristics ??: Stochastic error term , ??, ??, ??, ? : Parameters and vector, all to be estimated. ?: Quadratic term capturing nonlinearities 19
Income varying elasticities Differentiating the demand equation with respect to income gives the following: ?? denotes the long-run income elasticity for the given commodity, which varies across time, thereby enabling us to see, as income rises, whether and when consumption of a commodity plateaus. 20
Data and estimation Annual data over the period 1965-2017. Up to 63 countries, including advanced and emerging economies. Six metals: aluminum, copper, lead, nickel, tin and zinc. Three energy commodities: crude oil, natural gas and coal. Two group aggregates: energy and metals. Independent variables: Income, prices, population, urbanization, population density, investment ratio. The model is estimated by a pool mean group (PMG) estimation procedure The PMG ARDL procedure assumes homogeneity across all long-run estimators but allows for differences across countries in the short term. 21
Group-aggregate parameter estimates Energy Metals ?? 3.47*** 3.83*** 3.96*** 5.01*** 4.78*** 2.45*** ??2 -0.15*** -0.17*** -0.16*** -0.22*** -0.22*** -0.09*** ?? -0.17*** -0.15*** -0.10*** -0.26*** -0.25*** -0.12*** Urbanization 0.32*** 0.39*** Pop. density -0.28*** -0.24*** ? -0.08*** -0.09*** -0.12*** -0.19*** -0.21*** -0.29*** Notes: The dependent variable is the logarithm of aggregate energy consumption. Three (***), two (**), and one (*) asterisks denote significance of parameter estimates at 1, 5, and 10 percent level, respectively. indicates that the corresponding variable was not included in the model.
Elasticity estimates at various income levels Elasticity 3.0 Metals Energy China China (2017) U.S. (1997) U.S. (2017) 2.0 1.0 0.0 0 5,000 10,000 15,000 20,000 25,000 30,000 35,000 40,000 45,000 50,000 US$ per capita 55,000 Source: Authors calculations based on model s parameter estimates. Notes: The vertical lines denote the level of per capita income of the respective countries and years. Diamonds mark elasticities at $ 9,900 per capita income (sample median).
Controls and robustness checks for energy Elasticity 1.6 1.2 0.8 0.4 0.0 Base Investment share Urbanization Population Trend Price/RER 1965-97 1998-2017 Ex-China Ex-US All energy density Source: Authors calculations based on model s parameter estimates. Notes: Diamonds denote elasticities at $ 9,900 per capita income (sample median). The lower and upper ends denote elasticities at $ 28,000 and $ 9,900 per capita income, respectively.
Controls and robustness checks for metals Elasticity 1.6 1.2 0.8 0.4 0.0 Base Investment share Urbanization Population Trend Price/RER 1965-97 1998-2017 Ex-China Ex-US Reduced metals density Source: Authors calculations based on model s parameter estimates. Notes: Diamonds denote elasticities at $ 9,900 per capita income (sample median). The lower and upper ends denote elasticities at $ 28,000 and $ 9,900 per capita income, respectively.
Outline 26
Summary of results Individual demand equations gave highly heterogenous results across commodities. Including cross-prices confirms substitutability and (in some metals) complementarity Elasticities vary by income considerably. At median income levels of the sample (close to $ 10,000) income elasticities are close to unity. At China s per capita income, metals elasticity is 1.1 while for energy is 0.8. Both elasticities are around 0.2 at current US per capita income. Urbanization is a commodity-intensive process, but countries with high population density use less commodities than their sparsely populated counterparts. 27