Role of Multivariate Thinking in Statistics & Data Visualization
Explore the emerging role of multivariate thinking in inferential reasoning and the changing nature of data visualization in statistics education. Discussions cover topics like causal inference, statistical reasoning skills of students, and the impact of visualizations on data literacy.
Download Presentation

Please find below an Image/Link to download the presentation.
The content on the website is provided AS IS for your information and personal use only. It may not be sold, licensed, or shared on other websites without obtaining consent from the author. If you encounter any issues during the download, it is possible that the publisher has removed the file from their server.
You are allowed to download the files provided on this website for personal or commercial use, subject to the condition that they are used lawfully. All files are the property of their respective owners.
The content on the website is provided AS IS for your information and personal use only. It may not be sold, licensed, or shared on other websites without obtaining consent from the author.
E N D
Presentation Transcript
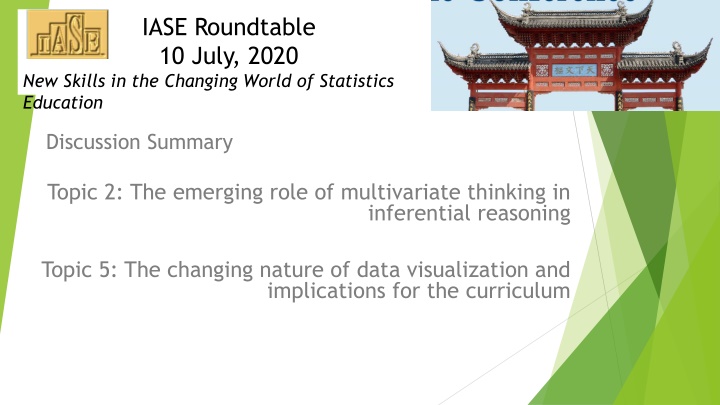
IASE Roundtable 10 July, 2020 New Skills in the Changing World of Statistics Education Discussion Summary Topic 2: The emerging role of multivariate thinking in inferential reasoning Topic 5: The changing nature of data visualization and implications for the curriculum
Topic 2: Now is the Time for Causal Inference in Introductory Statistics, Karsten Luebke A reasoning chain: Statistics is about understanding the world; the world is multivariable, which suggests a rethinking of curriculum to bring in multivariate analyses; if do not change statistics to gain insights through data, statistics runs the risk of becoming obsolete. Multivariate analysis can begin with exploratory data analysis and modeling by deemphasizing some content (i.e., formal inference) and omitting other content to bring in causal inference. A directed acyclic graph is a way to encode assumptions about the knowledge generating process. Students should learn about compounding and bias and be aware of oversimplified conclusions Causality is the heart of what we want to know about the world, but tension with formal inference: Can t isolate ourselves to randomized experiments but concern about claiming causation because of observation; need to think about approaching the concept from a different perspective. A question: do the graphs provide new insights or are they our a-priori assumptions - not new insights but what we start out with. Response: although qualitative assumptions are used in the graphs, there are testable implications and conditional on model and assumptions can calculate intervention effect.
TOPIC 5: The changing nature of data visualization and implications for the curriculum Tu e Balkaya (Turkey): An investigation of statistical reasoning skills of middle school students about distribution Charlotte Bolch (United States): Data scientists epistemic thinking for creating and interpreting visualizations and the impact for students data visualization literacy Joachim Engel (Germany): Visualizing multivariate data: Graphs that tell stories
Visualization opens opportunities to make statistics accessible to people with different levels of skills and to broader range of the population Return to the notion that the world is multivariable and overwhelmed with data visualizations- require basic numeracy and critical thinking to question legitimacy of statements and make sense of the visualizations (Engel) When people see a new visualization how do they think about it- what s happening in this graph? First steps in identifying the skills needed to create and interpret visualizations by convening a series of Delphi panelsof content experts from multiple fields (Charlotte Bolch) but care needs to be taken that the experts represent a wide set of people with different perspectives Reader as navigator, interpreter, designer and interrogator involves readers as consumers and producers The consensus strategies can provide structure for students on what they should be thinking about when creating or interpreting visualizations. Instructors model this structure when interpreting visualizations from news articles and in teaching students how to create new visualizations.
(Digital) Tools to encourage statistical thinking in meaningful contexts Data/graph sources: encourage statistical thinking in contexts that are meaningful Gapminder; Our World in Data, ProCivicStat (http://iase- web.org/islp/pcs/), New York Times (what's going on in this graph?), Financial Times, Population Pyramids, CoVid-19 graphics, Artic ice, Technology CODAP, R, Tableau, TinkerPlots, Jupyter Notebooks (Python), interactive dynamic handhelds, Mobile phones,
Disposition-accept new ways of thinking, willing to look outside of tradition, engage in the statistical stories Disposition is necessary component of statistical literacy (Engel, 2020; back to Gal, 2002) Meaningful data are key to motivation- what are we doing with statistics? Strategies to improve disposition include: compelling examples, motivating context, hot issues giving students/teachers a choice along with a structure
A home: Statistical literacy and capacity to understand graphs needs to be taught. Crosses all disciplines but has no real home in most countries Curricular guidelines may give general statements, but in reality little or nothing is in place The issues: math teachers not really involved with context do not feel comfortable with values and personal experience rather than right or wrong; social science teachers are math phobic and want to avoid statistics; many other disciplines do not deal well with variability Can begin in early grades with exploration of data in students lives; in middle school can explore concepts such as distribution using technology (Balkaya) Multivariate thinking does not exist in math beyond two dimensions (linear regression) Suggestion: recruit teachers who do math but also a second subject where they have to experience the messiness of the reality (Von Bing Yap, discussion*)
Overall Data are multivariate visualization is key to understanding data and their stories and role of technology is necessary to maximize opportunities to visualize bridge building from school to tertiary. Build bridges across disciplines (maths, statistics, computer science, politics, geography, etc.) Questions: What is data science? Who owns data science? Which implications do exist for us (statistics educators)?
References Gal, I. (2002). Statistical literacy: Meanings, components, responsibilities. In J. Garfield, & D. Ben-Zvi (Eds.). The challenge of developing statistical literacy, reasoning and thinking (pp. 47 78). Dordrecht: Kluwer.


