The report delves into how utilities play a vital role in enabling prosumers and flexible distributed energy resources, placing consumers at the heart of the energy system. It discusses the evolving landscape of the power sector, emphasizing the importance of technologies such as smart EV charging, battery storage, digitalization, and demand-side management in enhancing system flexibility. The narrative highlights the potential for a shift towards a greater number of electricity consumers becoming prosumers offering power and flexibility services to the grid intelligently.
Please find below an Image/Link to download the presentation.
The content on the website is provided AS IS for your information and personal use only. It may not be sold, licensed, or shared on other websites without obtaining consent from the author. If you encounter any issues during the download, it is possible that the publisher has removed the file from their server.
You are allowed to download the files provided on this website for personal or commercial use, subject to the condition that they are used lawfully. All files are the property of their respective owners.
The content on the website is provided AS IS for your information and personal use only. It may not be sold, licensed, or shared on other websites without obtaining consent from the author.
E N D
Presentation Transcript
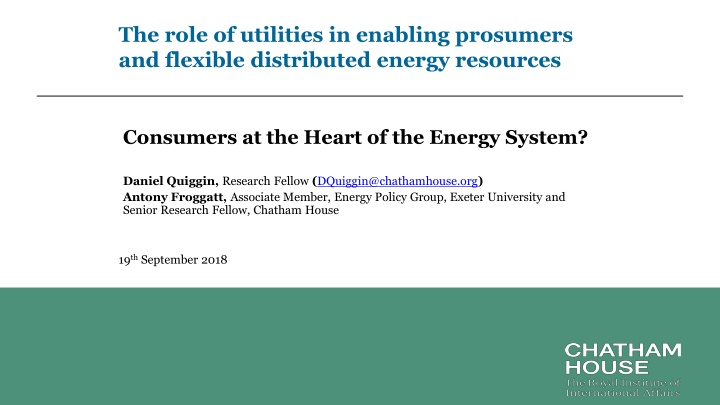
The role of utilities in enabling prosumers and flexible distributed energy resources Consumers at the Heart of the Energy System? Daniel Quiggin, Research Fellow (DQuiggin@chathamhouse.org) Antony Froggatt, Associate Member, Energy Policy Group, Exeter University and Senior Research Fellow, Chatham House 19thSeptember 2018
New Chatham House Report The race for electricity system flexibility is unleashing a new phase of transformations in the power sector, for which existing companies are ill prepared. Due to the accelerating deployment of an array of flexibility enablers , the spectre of cost escalation resulting from the expense of managing intermittent wind and solar power at huge volumes may never materialize. New technologies that enhance system flexibility include smart electric vehicle (EV) charging, battery storage, digitalization with intelligent control, and demand-side management. A growing number of electricity consumers could become prosumers , selling power and flexibility services back to the grid in an intelligent manner. Chatham House | The Royal Institute of International Affairs 2
Phase 1 transformations: three disrupters powering down utilities (1) Market reform + (2) Energy efficiency + (3) Renewables (1) Market reform Unbundling of stated owned power companies and privatisation of assets. New generators enter the market to increase competition Consumers able to choose from variety of suppliers Change in electricity consumption, 1985 2015 (2) Energy efficiency Cost effective, economically prudent mode to cut CO2 emissions 90% of Paris NDCs rely on energy efficiency Source: Source: Chatham House analysis of BP (2017), Statistical Review of World Energy 2017. Chatham House | The Royal Institute of International Affairs 3
Phase 1 transformations: (3) Renewables have come of age Renewable-power contracts agreed in 2015 17, with comparison of levelized cost of electricity (LCOE)29 values for coal, gas and nuclear generators Source: See Appendix Chatham House | The Royal Institute of International Affairs 4
U.S. utility share prices Share prices of major power utilities in the US and the composite (average) share price compared to the S&P 500 Index, rebased to 2005 300 US Composite S&P 500 250 Duke Share price rebased Dominion Energy 200 Southern Co 150 Exelon Corp American Electric Power 100 PG&E Corp Consolidated Edison 50 Dynegy Inc 0 Calpine Corp NRG Energy Many utilities are already adapting their business models in order to survive Source: Chatham House analysis of Thomson Reuters data (2018). Chatham House | The Royal Institute of International Affairs 5
The rise of decentralization Proportion of households in Australia with solar PV 20% 18% 16% 14% 12% Germany 10% UK 8% NY State 6% Australia 4% 0% 5% 10% 15% 20% 2% 0% Solar PV is the clearest example of the rise of decentralization Additional DERs 1.Electric Vehicles 2.Battery Storage 3.Digitalisation Note: Residential or household solar PV classified as under 9.5 KW. Source: Chatham House analysis of data from Australian Photovoltaic Institute (2017), http://pv-map.apvi.org.au/analyses (accessed 9 Nov. 2017). Chatham House | The Royal Institute of International Affairs 6
The Importance of Flexibility (1/3) RE penetration levels > 30% increased system integration costs (SIC) Share of generation in relation to current and expected system integration costs $20 $60/MWh (System flexibility dependent) up to $13/MWh Japan Brazil PV share in 2016 India China Wind share in 2016 United States Australia Italy Additional PV share in 2022 United Kingdom Germany Additional wind share in 2022 Spain Ireland Denmark 0% 10% 20% Penetration rate (share of annual generation) 30% 40% 50% 60% 70% Source : Adapted from IEA and UKERC Chatham House | The Royal Institute of International Affairs 7
The Importance of Flexibility (2/3) RE penetration levels > 30% increased system integration costs (SIC) Flexible electricity systems have lower SIC LCOE, SIC and WSC of solar PV and wind relative to the LCOE of nuclear power in 2030, at around 50 per cent variable renewable market share, under various flexibility scenarios Note: Conversion to dollars based on historical exchange rate.107 Source: Adapted from Strbac and Aunedi (2016), Whole-system cost of variable renewables in future GB electricity system. Chatham House | The Royal Institute of International Affairs 8
The Importance of Flexibility (3/3) RE penetration levels > 30% increased system integration costs (SIC) Flexible electricity systems have lower SIC Flexibility can be provided through centralized systems, what is new is the ability of DERs in providing flexibility and network services. The integration of variable renewables, combined with traditional drivers of network maintenance during routine replacement and upgrading, are creating the opportunity for new forms of value from the energy services DERs could provide. Chatham House | The Royal Institute of International Affairs 9
The challenges for decentralized flexibility Prosumers, who own DERs and could provide decentralized flexibility services, are currently locked out of the market. A number of factors prevent DERs from supplying services to the distribution system; 1. Valuing the range of services within both transmission and distribution networks 2. The creation of markets for these complex and locationally specific services. 3. Services need to be quantified, measured and coordinated new system operator functions within distribution network? Additionally; Conflict of interest in distribution utilities enabling services from DERs. Some services may not become valuable until the penetration of RE within any particular part of the network increases Chatham House | The Royal Institute of International Affairs 10
Valuing locationally specific DER services Network services inherently linked to physical constraints of distribution system locationally specific. Locational value necessitates locational marginal pricing (LMP) Accounting for geographically specific network variations (hence value) is complex LMP not the only means DERs can be attributed value value stack Zonal LMPs for distribution users served by each HV/MV substation Distribution-level active power LMPs Source: P rez Arriaga, I. and Knittel et al, C. (2016), 'Utility of the Future. An MIT Energy Initiative response, to an industry in transition . Chatham House | The Royal Institute of International Affairs 11
Dispatch and coordination & Market Platforms Most crucial functions provided by three entities; system operators, network providers and market platforms. Dispatch and coordination At transmission level undertaken by system operator DER services likely to be in competition with services provided by DNO assets DERs owned by third parties such as prosumers. Even playing field required between network assets (owned by DNO) and DERs. Reform of rate base / cost of service model (?) .. separation of DSO DNO (?) Market Platforms Connect and aggregate multiple DER prosumers; providing tools, services and rules to enable them to be efficiently coordinated and dispatched by the DSO. Markets within the distribution system may prove less liquid. Chatham House | The Royal Institute of International Affairs 12
Reforming the Energy Vision All-encompassing set of reforms utilities transform from cost-of-service to service platform model : create marketplaces, sell system data, charge transaction fees and create flexibility. DNOs themselves become Distribution System Platforms (DSPs) = combined DNO/SO REV incentivizes DER alternatives by setting the base rate on planned (forward-looking) CAPEX and removes a clawback mechanism Not all projects have been successful, market platforms yet to fully manifest. New York Public Service Commission prevents the DSP from owning DERs, apart from in exceptional circumstances. Brooklyn Microgrid Assets deployed by utility . Chatham House | The Royal Institute of International Affairs 13
Reforming the Energy Vision Currently, the VDER value stack is based on five key components;, 1. Energy (kWh) - market value of delivered united of energy 2. Capacity (kW) - market value of delivered capacity 3. Environmental - reduced emissions 4. Distribution System Value - value of avoiding new distribution system capacity due to reducing distribution system peak demand 5. Locational System Relief - location-specific value e.g. voltage support or avoiding infrastructure upgrades. Undermining the transformational power of REV ? 1. Clear methodology to calculate VDER yet to emerge 2. Lack of distribution level LMP 3. Unbundling : even playing field Chatham House | The Royal Institute of International Affairs 14
Australia a test bed for market platforms Australian Energy Council and Energy Networks Australia transition to combined DNO/SO = distribution network service providers (DNSP) growing role of market platforms = network optimisation markets (NOM) Higher penetration levels DNOs are beginning to respond. Ausgrid already upgrading Distribution Network Management System Market platforms Simplistic to begin with, gradually developing greater sophistication. Until threshold : minimal impact on the functioning of the DNSP. Source: Energy Networks Australia (2017), Electricity Network transformation Roadmap: Final Report. Chatham House | The Royal Institute of International Affairs 15
Australia a test bed for market platforms deX brings together DERs in a competitive market structure. deX has the potential to go further than peer-to-peer trading, allowing for the first time, prosumers to trade in DER grid services. Bids and offers from multiple DERs are aggregated from solar PV, batteries and flexible demand from deX households provide DNO with least-cost balancing mechanisms. DSO-type functionality is provided by GreenSync software in collaboration with network operators United Energy and ActewAGL. Factors driving Australian developments 1. Higher penetration levels 2. Innovative startups filling gap in market Chatham House | The Royal Institute of International Affairs 16
Conclusions Prosumers are partially locked out of the market - lack of mechanisms to discover new DER values - particularly in relation to locationally specific services within the distribution network. DERs need an even playing field with traditional DNO network assets DNOs are key to unlocking VDER - will need to adopt new functions Whilst deX shows promise in connecting DERs and prosumers, market platforms under REV have struggled. As market platforms grow in size operational impacts will likely require greater separation financial or legal between DSO, DNO and the market platforms. Unbundling may prove more difficult for distribution utilities, as the distribution network is orders of magnitude more complex than the transmission network. Chatham House | The Royal Institute of International Affairs 17
Thank you Chatham House would like to thank Reliance Industries Limited, the CLP Group and the MAVA Foundation for their generous financial support. The authors wish to express their appreciation to Francis O'Sullivan, Director of Research for the MIT Energy Initiative, for his review and advice as well as Felix Preston, Senior Research Fellow and Deputy Research Director, Energy, Environment and Resources Department, Chatham House, for his guidance and advice. Chatham House | The Royal Institute of International Affairs
Categories of SIC impacts in relation to renewable generators SIC impact Description System balancing and Variable renewables may increase supply fluctuations, leading to increased system balancing held in reserve. SIC: $14 42/MWh (35 per cent penetration).i reserve Peak demand capacity As a proportion of installed capacity, renewables tend to replace less of the capacity required to meet peak demand than (capacity credit) conventional generators; as such, the system capacity increases. Capacity credit is a measure of how much capacity can be replaced without reducing system reliability. SIC: $3 25/MWh (30 per cent penetration).ii Network upgrading New and reinforced network cables may be required to enable power from renewables to reach centres of demand. SIC: $7 49/MWh (30 per cent penetration).iii Curtailment of Curtailment (lowering the useful power output) tends to result either from the power being transferred exceeding network renewables capacity or from renewable supply exceeding demand. Conventional plant Balancing renewables variability results in ramping costs the burning of additional fuel to reach operating conditions. ramping Frequency regulation The spinning inertia of conventional generators provides frequency stabilization. Renewables increase the need for dedicated frequency regulation services. Merit order effect Low-cost or prioritized renewable generation results in conventional generators operating for fewer hours, reducing their profitability. As their services may be still required (e.g. to provide peak demand capacity), subsidized operation (e.g. in the form of capacity credits) may be necessary. Chatham House | The Royal Institute of International Affairs 19
References - Renewable Contracts (1) PV Magazine (2015), Japan s SoftBank wins bid for 350 MW Indian solar farm pv magazine International. [Online]. Available: https://www.pv-magazine.com/2015/12/16/japans-softbank-wins- bid-for-350-mw-indian-solar-farm_100022466/. [Accessed: 20-Sep-2017]. (2) PV Magazine (2015), Solar wins substantial contracts in Chile s energy supply auction. [Online]. Available: https://www.pv-magazine.com/2015/10/28/solar-wins-substantial-contracts-in-chiles- energy-supply-auction_100021755/#ixzz40uobeKSr. [Accessed: 20-Sep-2017]. (3) PV MagazineUrbasolar awarded 80 MW in France s latest solar auction. [Online]. Available: https://www.pv-magazine.com/2015/12/21/urbasolar-awarded-80-mw-in-frances-latest-solar- auction_100022527/#ixzz40up6QwwB. [Accessed: 20-Sep-2017]. (4) RenewEconomy (2016), ARENA tender suggests solar PV costs to fall below $A100/MWh. [Online]. Available: http://reneweconomy.com.au/arena-tender-suggests-solar-pv-costs-to-fall-below- a100mwh-98752/. [Accessed: 20-Sep-2017]. (5) PV Tech (2016), Germany s third solar auction sees prices lower again | PV Tech. [Online]. Available: https://www.pv-tech.org/news/germanys-third-solar-auction-sees-prices-lower-again. [Accessed: 20-Sep-2017]. (6) Enerdata (2016), Mexico awards 1,720 MW of wind and solar projects through tender. [Online]. Available: https://www.enerdata.net/publications/daily-energy-news/mexico-awards-1720-mw- wind-and-solar-projects-through-tender.html. [Accessed: 20-Sep-2017]. (7) Bloomberg (2016), Dubai s DEWA Announcing Utility-Scale Solar Tender on Thursday. [Online]. Available: https://www.bloomberg.com/news/articles/2016-05-31/dubai-s-dewa-announcing- utility-scale-solar-tender-on-thursday. [Accessed: 20-Sep-2017]. (8) sonnenseite.com (2016), Solarpack is awarded a 280 GWh/year contract in Chile with a record bid of 29.1 US$/MWh. [Online]. Available: http://www.sonnenseite.com/en/energy/solarpack-is- awarded-a-280-gwh-year-contract-in-chile-with-a-record-bid-of-29.1-us-mwh.html. [Accessed: 20-Sep-2017]. (9) RenewEconomy (2016), New low for wind energy costs: Morocco tender averages $US30/MWh. [Online]. Available: http://reneweconomy.com.au/new-low-for-wind-energy-costs-morocco- tender-averages-us30mwh-81108/. [Accessed: 20-Sep-2017]. (10) Bloomberg (2016), Cheapest Solar on Record Offered as Abu Dhabi Expands Renewables. [Online]. Available: https://www.bloomberg.com/news/articles/2016-09-19/cheapest-solar-on-record- said-to-be-offered-for-abu-dhabi. [Accessed: 20-Sep-2017]. (11) CleanTechnica (2017), Indian Wind Prices Reach Record Low In 1 Gigawatt Auction. [Online]. Available: https://cleantechnica.com/2017/03/01/indian-wind-prices-reach-record-low-1-gigawatt- auction/. [Accessed: 20-Sep-2017]. (12) Business Green (2017), Germany onshore wind auction fetches unexpected low price. [Online]. Available: https://www.businessgreen.com/bg/news/3010479/germany-onshore-wind-auction- fetches-unexpected-low-price. [Accessed: 20-Sep-2017]. (13) WindEurope (2017), Spain returns to wind energy with record low prices. [Online]. Available: https://windeurope.org/newsroom/press-releases/spain-returns-to-wind-energy-with-record-low- prices/. [Accessed: 20-Sep-2017]. (14) The Guardian (2017), Indian solar power prices hit record low, undercutting fossil fuels. [Online]. Available: https://www.theguardian.com/environment/2017/may/10/indian-solar-power-prices- hit-record-low-undercutting-fossil-fuels. [Accessed: 20-Sep-2017]. (15) Bloomberg (2017), Offshore Wind Farms Offer Subsidy-Free Power for First Time. [Online]. Available: https://www.bloomberg.com/news/articles/2017-04-13/germany-gets-bids-for-first- subsidy-free-offshore-wind-farms. [Accessed: 20-Sep-2017]. Chatham House | The Royal Institute of International Affairs 20


 Renewables have come of age")


")
")
")