Romania's Economic Indicators and Freedom Index Analysis in 2015
Explore Romania's economic performance in 2013, including public debt, current account deficit, net international investment position, and more. Delve into the Index of Economic Freedom for 2015 comparing Romania, Germany, Greece, and Portugal, analyzing indicators such as property rights, corruption, business freedom, labor freedom, and more. Additionally, examine productivity per hour worked in the Eurozone and select countries from 2000 to 2016. Lucian Croitoru provides valuable insights and data in this comprehensive analysis.
Download Presentation

Please find below an Image/Link to download the presentation.
The content on the website is provided AS IS for your information and personal use only. It may not be sold, licensed, or shared on other websites without obtaining consent from the author. If you encounter any issues during the download, it is possible that the publisher has removed the file from their server.
You are allowed to download the files provided on this website for personal or commercial use, subject to the condition that they are used lawfully. All files are the property of their respective owners.
The content on the website is provided AS IS for your information and personal use only. It may not be sold, licensed, or shared on other websites without obtaining consent from the author.
E N D
Presentation Transcript
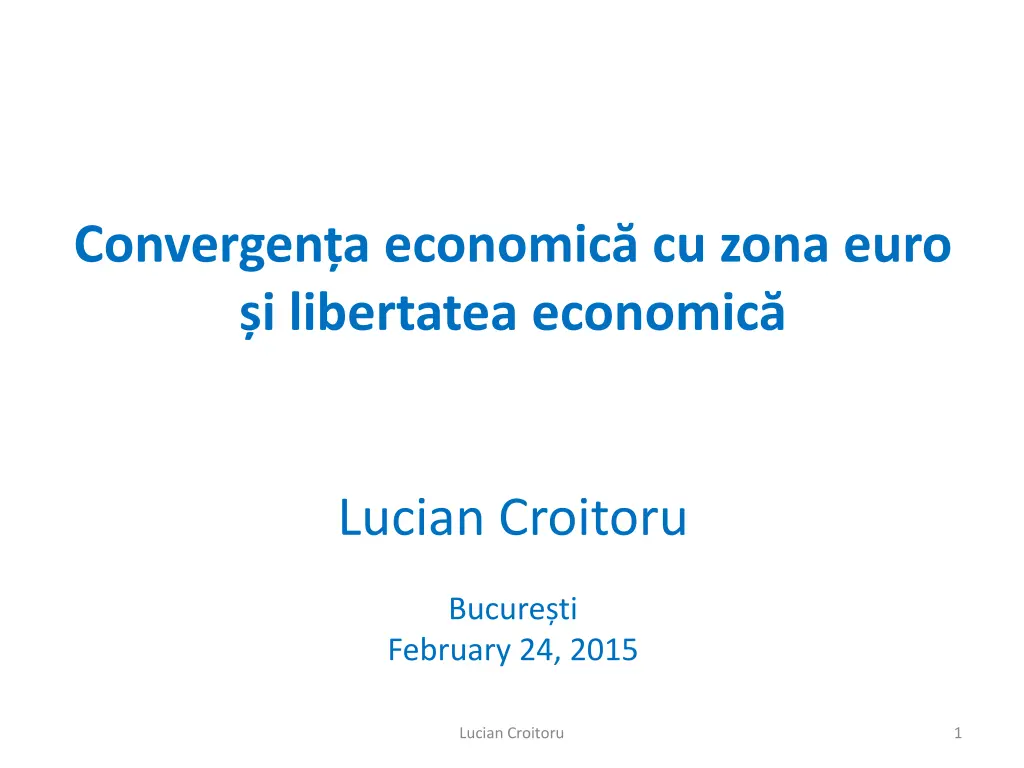
Convergena economic cu zona euro i libertatea economic Lucian Croitoru Bucure ti February 24, 2015 Lucian Croitoru 1
Romania`s scoreboard indicators in 2013 Public debt: 37, 9 % of GDP Curent account (CA) deficit (average over the past 3 years): 3,3 % of GDP Net international investment position: -61,5 % of GDP Real effective exchange rate (percentage change over the past 3 years): 0,3 Market share of exports of goods and services (percentage change over the last 5 years): 16,4 Unit labor cost (percentage change over the past 3 years): 0,7 Houses price index (annual percentage change): -4,6 Private sector debt: 66,4 % of GDP Credit flow to the private sector: -1,5 % of GDP Unemployment rate: 7 % Financial sector total liability (annual change): 3,1 % Lucian Croitoru 2
Index of economic freedom for 2015 in Romania and Germany Indicator Romania (66,6; ranks 57) Germany (73,8; ranks 16) Source: Freedom House RoL=rule of law; RE=regulatory efficiency; LG=low government; OM=open markets; - indicates a decrease as compared to the previous year; + indicates an increase as compared to the previous year; ~ = stable Property Rights (RoL) 40.0 ~ 90,0 ~ Freedom From Corruption (RoL) 43.0 +78,0 - Business Freedom (RE) 69.8 - 88,2 - Labor Freedom (RE) 68.6 + 51,2 + Monetary Freedom (RE) 77.3 + 81,5 + Government Spending (LG) 62.3 + 40,1 + Fiscal Freedom (LG) 86.9 - 60,8 - Trade Freedom (OM) 88.0 + 88,0 + Investment Freedom (OM) 80.0 ~ 90,0 ~ Financial Freedom (OM) 50.0 ~ 70, 0 ~ Lucian Croitoru 3
Producia pe ora lucrat n zona euro i n Grecia, Spania, Portugalia i Finlanda. rile sunt sub media EA- 15 (PPS, EA-15=100, %) 110 Zona Euro-15 Finland 90 Spania Grecia 70 Portugalia 50 2000 2001 2002 2003 2004 2005 2006 2007 2008 2009 2010 2011 2012 2013 2014 2015 2016 Lucian Croitoru 4
Index of economic freedom for 2015 in Romania and Germany Indicator Greece (54; ranks 130) Portugal(65,3; ranks 64) Source: Freedom House RoL=rule of law; RE=regulatory efficiency; LG=low government; OM=open markets; - indicates a decrease as compared to the previous year; + indicates an increase as compared to the previous year; ~ = stable Property Rights (RoL) 40.0 ~ 70.0 ~ Freedom From Corruption (RoL) 40.0 +62.0 + Business Freedom (RE) 73.3 - 87.5 + Labor Freedom (RE) 51.6 - 42.9 + Monetary Freedom (RE) 77.8 + 82.8 + Government Spending (LG) 0.0 - 28.8 + Fiscal Freedom (LG) 64.2 - 61.1 + Trade Freedom (OM) 83.0 + 88.0 + Investment Freedom (OM) 60.0 ~ 70.0 ~ Financial Freedom (OM) 50.0 ~ 60.0 ~ Lucian Croitoru 5
Index of economic freedom for 2015 in Romania and Germany Indicator Spain (67,6; ranks 49) Finland (73,8; ranks 16) Source: Freedom House RoL=rule of law; RE=regulatory efficiency; LG=low government; OM=open markets; - indicates a decrease as compared to the previous year; + indicates an increase as compared to the previous year; ~ = stable Property Rights (RoL) 70.0 ~ 90.0 ~ Freedom From Corruption (RoL) 59.0 -89.0 - Business Freedom (RE) 77,5 + 92.6 - Labor Freedom (RE) 52.6 + 54.8 + Monetary Freedom (RE) 81.5 + 79.9 + Government Spending (LG) 39,8 + 3.6 - Fiscal Freedom (LG) 53.1 - 66.4 + Trade Freedom (OM) 88.0 + 88.0 + Investment Freedom (OM) 85.0 + 90.0 ~ Financial Freedom (OM) 70.0 ~ 80. 0 ~ Lucian Croitoru 6
Producia pe ora lucrat n zona euro i Estonia, Lituania i Letonia. Convergen c tre un nivel nc foarte ndep rtat (PPS, EA-15=100, %) 120 Zona euro-15 100 80 EA(+LT) EE Lituania 60 LV Estonia LT Letonia 40 20 2000 2001 2002 2003 2004 2005 2006 2007 2008 2009 2010 2011 2014 2015 2016 2012 2013 Lucian Croitoru 7
Producia pe ora lucrat n zona euro i n Romnia, Polonia, Ungaria i Bulgaria. Convergen c tre un nivel nc foarte ndep rtat. (PPS, EA-15=100, %) 120 Zona euro-15 100 80 60 Ungaria Polonia Rom nia 40 Bulgaria 20 0 2000 2001 2002 2003 2004 2005 2006 2007 2008 2009 2010 2011 2012 2013 2014 2015 2016 Lucian Croitoru 8
Producia pe ora lucrat n zona euro i n rile dezvoltate din UE. Cele mai mute ri sunt peste media EA-15 (PPS, EA-15=100, %) 130 125 EA(+LT) 120 BE 115 DK 110 DE 105 NL FR 100 AT 95 SE 90 IT 85 2000 2001 2002 2003 2004 2005 2006 2007 2008 2009 2010 2011 2014 2015 2016 2012 2013 9 Lucian Croitoru
Structural reforms are key to GDP growth Make property rights clearer Privatize more and faster Make hard decisions regarding ailing SOEs sooner Institute the rule of law Justice reform key to enterprise restructuring and restoring sentiment of confidence Lucian Croitoru 10
GDP growth rates in selected developed countries (10 year-moving averages, %) 6 The era of financial liberalizations 5 France 4 Germany 3 Italy The Netherlands 2 Austria USA A B 1 Sursa: author's computations usind the UK C Japan 0 -1 1957 1961 1965 1969 1973 1977 1989 1993 1997 2001 2005 2009 2013 1981 1985 11 Lucian Croitoru
rile cu productivitatea cea mai mare au i cele mai mici ritmuri de cre tere economic Va fi convergen , dac nu se fac gre eli majore Pe termen lung putem avea ncredere c legea regresiei c tre media care ac ioneaz n natur va func iona. Dar e vorba de o lung perioad de timp Cre terea rapid din perioada anilor 50 i 70 din SUA este doar o anomalie, care a compensat sc derea din anii 30 Decizia de adoptare a euro trebuie s fie legat de productivitate Productivitatea va converge odat cu progresul tehnologic, cu promovarea educa iei i cu produc ia de mas Lucian Croitoru 12
Costurile unitare cu munca n ri europene dezvoltate (2010=100, %) 130 120 BE 110 DK 100 DE FR 90 IT NL 80 AT SE 70 60 2000 2001 2002 2003 2004 2006 2007 2008 2009 2010 2011 2012 2013 2014 2015 2016 2005 13 Lucian Croitoru
Costurile unitare cu munca n Grecia, Spania, Portugalia i Finlanda (2010=100, %) 120 110 100 GR 90 ES PT 80 FI 70 60 2001 2002 2003 2004 2005 2007 2008 2009 2010 2011 2012 2013 2014 2015 2016 2000 2006 14 Lucian Croitoru
Costurile unitare cu munca n Lituania, Estonia i Letonia (2010=100, %) 130 120 110 100 LV 90 LT 80 EE 70 60 50 2000 2001 2002 2003 2004 2005 2006 2007 2008 2009 2010 2011 2012 2013 2014 2015 2016 15 Lucian Croitoru
Costurile unitare cu munca n Romnia, Bulgaria, Polonia i Ungaria (2010=100, %) 130 120 110 100 BG 90 RO HU 80 PL 70 60 50 2001 2002 2003 2004 2005 2006 2007 2008 2009 2010 2011 2012 2014 2015 2016 2000 2013 16 Lucian Croitoru


