Root Cause Analysis for Customer Dissatisfaction: Solutions for Better Service
Explore the root causes of poor customer satisfaction at service centers, including improper vehicle servicing and financial problems. Learn how a thorough analysis can lead to improvements in service quality and customer experience.

Download Presentation

Please find below an Image/Link to download the presentation.
The content on the website is provided AS IS for your information and personal use only. It may not be sold, licensed, or shared on other websites without obtaining consent from the author. If you encounter any issues during the download, it is possible that the publisher has removed the file from their server.
You are allowed to download the files provided on this website for personal or commercial use, subject to the condition that they are used lawfully. All files are the property of their respective owners.
The content on the website is provided AS IS for your information and personal use only. It may not be sold, licensed, or shared on other websites without obtaining consent from the author.
E N D
Presentation Transcript
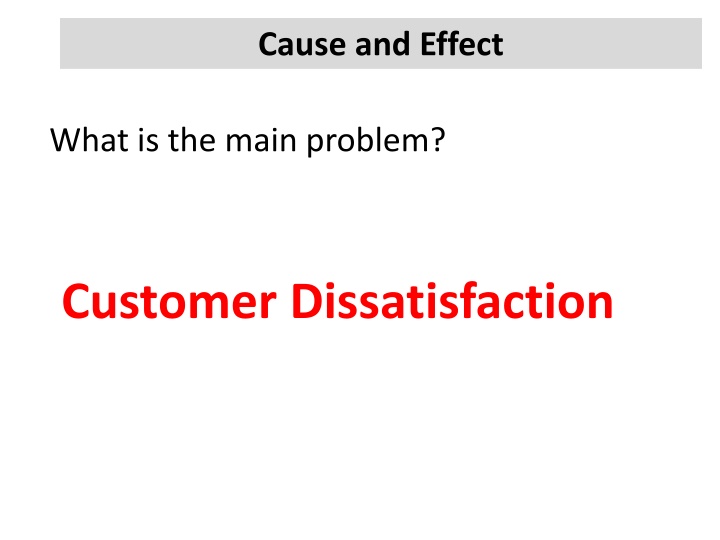
Cause and Effect What is the main problem? Customer Dissatisfaction
Cause and Effect Performance of employees are not in satisfactory level due to poor salary. Performance of employees are not in satisfactory level due to poor salary. Performance of employees = Effect poor salary = Cause
Cause and Effect Sales of TATA vehicles has increased from last month due to cash back offer. Sales of TATA vehicles has increased from last month due to cash back offer. Sales of TATA vehicles has increased = Effect Due to cash back offer= Cause
Cause and Effect- Consider timing We need additional 15 service centers at city areas as the vehicle population increased on last 3 years. We need additional 15 service centers at city areas as the vehicle population increased on last 3 years. We need additional 15 service centers = Effect vehicle population increased on last 3 years=Cause
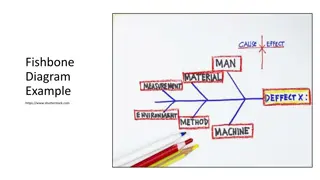
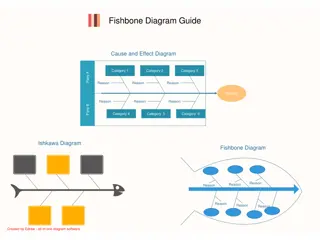
Fish Bone Diagram Cause and Effect Diagram Ishikawa Diagram as created by Kaoru Ishikawa (1968) One of the Seven Basic Tools of Quality
Root Cause Analysis Step 1: Ask Why Did This Happen Step 2: Check Is This a Root Cause? Step 3: If not , go to step 1
Fish Bone Diagram Route Cause 1 Route Cause 2 Problem Type Route Cause 3 Route Cause 4
Poor Customer Satisfaction at Service centre Improper Vehicle Servicing No Service planning No Schedule/ Service record Multiple Owner/ User Multiple Owner/ User Financial Problem Vehicle Off road
Poor Customer Satisfaction at Service centre Improper Vehicle Servicing Financial Problem Long distance of Service Center Multiple Owner/ User Service Cost is high No Service planning Vehicle Off road
Fish Bone Diagram- factors need to consider on analysis The 7 P's (used in marketing industry) Product/Service Price Place Promotion People/personnel Process Physical Evidence The 5 M's (used in manufacturing industry) Machine (technology) Method (process) Material (Includes Raw Material, Consumables and Information.) Man Power (physical work)/Mind Power (brain work) Measurement (Inspection) in service marketing. The 5 S's (used in service industry) Surroundings Suppliers Systems Skills Safety
Fish Bone Diagram for High Fuel Consumption and Engine Noise Manage ment Man Method Forgot to set alarm Staff bus Driver Late Heavy Traffic on Road Choose wrong route Late at Office Security officer delayed to open the Door Delay To go bed** Incorrect Time on Alarm Clock Punch Machine Malfunctioning Cough syrup/ Slipping pill for medication Bus off-road Wrong estimation on Time/ Road traffic Measurement Machine Material
Common Mistakes Cause and effect confusion No route cause Analysis Too much information/ Absent of key words